Can Foundation Giving Relate Better to Society’s Needs Over Time?
Posted: June 18, 2013 Filed under: Economic Growth and Productivity, Income and Wealth, Nonprofits and Philanthropy, Shorts, Taxes and Budget 1 Comment »Charitable organizations form a vital part of America’s safety net. Ideally, foundations would be able to make greater payouts in hard economic times when needs are greatest. Unfortunately, the design of today’s excise tax on foundations undermines and in fact discourages such efficiency.
Under current law, private foundations are required to pay an excise tax on their net investment income. The tax rate is 2 percent, but it can be reduced to 1 percent if the foundation satisfies a minimum distribution requirement. The dual-rate structure and distribution requirements obviously introduce complexity. The stated purpose of the tax in legislative history—to finance IRS activities in monitoring the charitable sector—has never been fulfilled.
In the recent recession, the impact of the excise tax was especially pernicious, as it penalized those that maintained their level of grantmaking.
How? As Martin Sullivan and I first described in 1995, the excise tax penalizes spikes in giving; under the current formula, a temporarily higher payout results in a higher excise tax when payouts fall back to previous levels. A foundation that reduced its grantmaking during the last recession would not be subject to an increased excise tax because the amount the foundation paid out would be measured as a share of current net worth.
One proposal would replace the excise tax with a single-rate tax yielding the same amount of revenue. While a flat-rate tax would remove the disincentive to raise grantmaking in bad times, it still raises taxes for some foundations and not others.
A related law applying to foundations is the required payout rate, now set at 5 percentage points. Many experts have debated how high that rate should be. The current rate is believed to approximate the long-term real rate of return on a foundation’s balanced portfolio of assets. However, if foundations follow a strict rule of paying out the minimum 5 percent every year, they, too, will be operating procyclically, paying out more in good times when stock markets are high and less in bad times.
If we wish foundations to operate more countercyclically—to pay out more when needs are greater—we need to address both the excise tax and the natural tendency, reinforced by a minimum payout requirement, to make grants and payouts as a fixed percentage of each year’s net worth.
Growth in Income and Health Care Costs
Posted: June 4, 2013 Filed under: Columns, Economic Growth and Productivity, Health and Health Policy, Income and Wealth, Race, Ethnicity, and Gender 4 Comments »Worried about the stagnation of income among middle-income households? Or about the growth in health care costs? The two are not unrelated. In fact, middle-income families have witnessed far more growth than the change in their cash incomes suggest if we count the better health insurance most receive from employers or government. But is that all good news? Should ever-increasing shares of the income that Americans receive from government in retirement and other transfer payments go directly to hospitals and doctors as opposed to other needs of beneficiaries? Should workers receive ever-smaller shares of compensation in the form of cash?
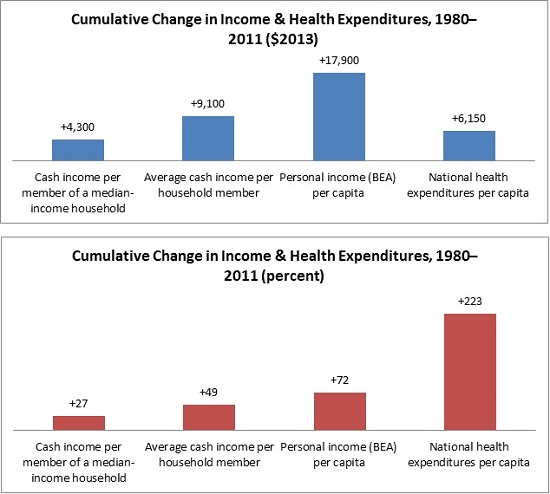
The stagnation of cash incomes in the middle of the income distribution now goes back over three decades. Consider the period from 1980 to 2011. Cash income per member of a median income household, which includes items like wages and interest and cash payments from government like Social Security, only grew by about $4,300 or 27 percent over that period, when adjusted for inflation. From 2000 to 2010, it was even negative. Yet according to data from the Bureau of Economic Analysis, per capita personal income—our most comprehensive measure of individual income—grew 72 percent from 1980 to 2011.
How do we reconcile these statistics? By disentangling the many pieces that go into each measure.
Growing income inequality certainly plays a big part in this story: much of the growth in either cash or total personal income was garnered by those with very high incomes. So the growth in average income, no matter how measured, is substantially higher than the growth for a typical or median person who shared much less than proportionately in those gains. But personal income also includes many items that simply don’t show up in the cash income measures. Among them is the provision of noncash government benefits, such as various forms of food assistance.
Health care plays no small role. In fact, real national health care expenditures per person grew by 223 percent or $6,150 from 1980 to 2011, much more than the growth in median cash income. If we assume that the median-income household member got about the average amount of health care and insurance, then we can see how little their increased cash income tells them or us about their higher standard of living.
Getting a bit more technical, there’s a danger of over-counting and under-counting health care costs here. Some of the median or typical person’s additional cash income went to extra health care expenses, so the additional amount he/she had left for all other purposes was even less than $4,300. However, individuals pay only a small share of their health care expenses; the vast majority is covered by government, employer, or other third-party payments. So, roughly speaking, typical or median individuals still got well more than half of their income growth in the form of health benefits.
The implications stretch well beyond middle-class stagnation. Employers face rising pressures to drop insurance so they can provide higher cash wages. For instance, providing a decent health insurance package to a family can be equivalent roughly to a doubling of employer costs for a worker paid minimum wage. The government, in turn, faces a different squeeze: as it allocates ever-larger shares of its social welfare budget for health care, it grants smaller shares to education, wage subsidies, child tax credits, and most other efforts. Additionally, the more expensive the health care the government provides to those who don’t work, the greater the incentives for them to retire earlier or remain unemployed.
In the end, the health care juggernaut leaves us with good news (that our incomes indeed are growing moderately faster than most headlines would have us believe) as well as bad news (that health care remains unmerciful in what it increasingly takes out of our budget).
Homeownership as a Means of Reducing Wealth Disparities
Posted: May 30, 2013 Filed under: Columns, Economic Growth and Productivity, Income and Wealth, Race, Ethnicity, and Gender 2 Comments »COAUTHORED WITH DOUG WISSOKER
A recent paper by Bayer, Ferreira, and Ross on mortgage delinquencies and foreclosures finds that people of color had greater problems once Recession hit than did many others in roughly equal circumstances, such as income and location, but with different racial backgrounds. We believe this is a useful, though not surprising, finding in ongoing studies of the impact of the Recession on different types of households. Yet we worry about how its results get extrapolated into policy recommendations.
The paper concludes that their research “raises concerns about homeownership as a vehicle for reducing racial wealth disparities”. We believe that one needs to be very careful in extrapolating lessons from the market of the mid-2000s to any market and to policies that would apply over time. Paying off mortgages is the primary means by which the majority of households, particularly low and moderate-income households, save over time. Discouraging such saving could easily add to already unequal distribution of wealth in society.
First, a quick summary of the findings. Combining several sources of data to look at racial differences in delinquent payments and foreclosures for mortgages for purchases and refinances originated between 2004 and 2008, the authors find that black and Hispanic borrowers had substantially higher delinquency and foreclosure rates than whites and Asians, even controlling for differences in circumstances such as the borrower’s credit score, the size of the interest rate spread of the loan, and the identity of the lender. In addition, the authors conclude that the racial gap in delinquent payments and foreclosures peaked for loans originating in 2006. From this, they conclude that people of color entering the market at the peak of the housing boom were particularly vulnerable to adverse economic conditions.
The authors attribute the racial difference found for blacks and Hispanics, even after trying to control for income or other differences, to items they couldn’t measure, including lower wealth and an accompanying lack of a financial cushion. This seems crucial to us and is also consistent with studies that income an incomplete predictor of upward or downward mobility. Work from the Urban Institute (here) shows that wealth differentials by race are much greater than income differentials. These differentials can play out in multiple ways across generations. For instance, wealthier families provide more inheritances and intergenerational transfers that support homebuying and downpayment levels that reduce foreclosure risk.
However, the authors’ concern about homeownership as a vehicle for reducing racial wealth disparities does not follow logically. Evidence here is at best circumstantial. Among other sources of disparate outcomes, consumer groups would point out that these types of findings more than anything highlight the disparate impact of abusive lending at the height of the housing boom.
Portfolio theory requires looking across different types of assets and debts, along with their associated expected returns and risks. Homeownership has risks, but so does renting. In fact, rental rates at times rise faster than the costs of homeownership, and in many parts of the country it has become cheaper to own than rent for those likely to be in a home long enough that transactions costs do not eat away at the ownership returns. Similarly, a household often must choose among debt instruments. Mortgages tend to have lower interest charges than most other forms of debt.
Most vehicles for getting a decent return on investment involve some risk. Saving accounts now paying negative, after-inflation, returns only prove the point in spades. If saving were proportionate to income, for instance, but lower-income individuals invest only in low or negative return assets, then wealth inequality necessarily would grow to be much greater than implied by levels of saving, potentially compounding adverse outcomes over time. Conversely, without discounting lessons from the Great Recession, low-cost, well-structured mortgages continue to be supported by the government (whether through FHA or the GSEs) partly for the very purpose of diversifying risk and effectively spreading wealth ownership.
This study is based on patterns of delinquency and foreclosure rates observed during a limited time period with unusually high foreclosure rates. But, wealth accumulation occurs over a very long time. Thus, even on this paper’s own terms, it’s not clear that reduced rates of homeownership would make low-income households or people of color better off over extended periods. We have found that most homeowners buying a decade or so before the Great Recession came through the longer period in good shape. Our own work also tends to show that black homeownership rates, even after controlling for income, are disproportionately low in both good and bad markets, raising serious questions about whether they are missing out on opportunities available to others.
Regardless of the effect on the difference in wealth disparity by race, homeownership is an effective way for many, though certainly not all, low- and moderate-income households to save. Equity in a home is the primary asset owned by low- and middle-income households, including blacks and Hispanics, by the time of retirement. Paying off a mortgage is the primary mechanism by which these households save, with all the virtues of a more automatic and regular saving vehicle. Reductions in the already low homeownership of people of color would almost certainly exacerbate over time the unequal distribution of wealth.
Reforming Social Security Benefits
Posted: May 23, 2013 Filed under: Aging, Columns, Income and Wealth 18 Comments »Excerpt from “Reforming Social Security Benefits,” Testimony Before the House Ways and Means Subcommittee on Social Security.
In this testimony, I would like to focus on the need for Social Security benefit reform regardless of the current imbalances in the system or the taxes raised to support the system.
Why? Despite Social Security’s great success, its growth in lifetime benefits over time has been decreasingly targeted at its major goals. Even while programs for children and working families are being cut, combined lifetime benefits for couples turning 65 rise by an average of about $20,000 every year, so that couples in their mid-40s today are scheduled to get about $1.4 million in lifetime benefits, of which $700,000 is in Social Security.
Social Security has morphed into a middle-age retirement system. Typical couples are receiving close to three decades of benefits. Smaller and smaller shares of Social Security benefits are being devoted to people in their last years of life.
If people were to retire for the same number of years as they did when benefits were first paid in 1940, a person would on average retire at age 76 today rather than 64. Soon close to a third of adults will be on Social Security, retiring on average for a third of their adult lives.
While Social Security did a good job reducing poverty in its early years, it has made only modest progress recently, despite spending hundreds of billions of dollars more. The program discourages work among older Americans at the very time they have become a highly underused source of human capital in the economy.
The failure to provide equal justice permeates the system. It discriminates against single heads of household, spouses with relatively equal earnings, those who bear their children before age 40, long-term workers, and many others. At the same time, private retirement policy leaves most elderly households quite vulnerable.
Unfortunately, the Social Security debate has largely proceeded on the basis of being “for the box” or “against the box.” The contents themselves deserve scrutiny.
How might one break through the stalemate and find areas of mutual agreement? While I applaud the efforts of the Simpson/Bowles Commission and the Bipartisan Policy Commission I believe we can go much further to address the problems I just raised. How? We should start with a basic set of principles and see where they lead us.
Consider. Inevitably balance will be paid for mainly through benefit cuts or tax increases on higher income individuals who have most of the resources. That debate need not derail other needed reforms. I suggest proceeding in the following order:
First, consider reforms aimed at meeting Social Security’s primary purposes:
- providing greater protections for those truly old or with limited resources;
- supporting the work and saving base that undergird the system; and
- providing more equal justice for those suffering needless discrimination in the system, like single heads of household and longer-term workers.
Some of those fixes cost money, and some raise money; we don’t have to address trust fund and distributional consequences in each and every change.
Second, further adjust minimum benefits and the rate schedule and indexing of that schedule over time to achieve final cost and distributional goals. The extent of these adjustments will also depend upon the tax rate and base structure agreed upon.
My testimony provides a fairly detailed way to engage this type of reform process. It largely follows the logic I applied to taxation when serving as the economic coordinator of the Treasury effort that led to the bipartisan-supported Tax Reform Act of 1986, and in my testimony before the Simpson/Bowles Commission.
Wealth Accumulation by Race Over the Life Cycle
Posted: April 29, 2013 Filed under: Income and Wealth, Race, Ethnicity, and Gender, Shorts 1 Comment »While the income inequality among different racial and ethnic groups is significant, it is nothing compared to wealth inequality. In 2010, whites had six times more average wealth than blacks and Hispanics ($632,000 versus $103,000). The income gap, by comparison, was twofold ($89,000 versus $46,000).
In a recent study, several colleagues and I examine in more depth how these ratios are affected by wealth accumulation over a person’s lifetime. Early in wealth-building years (when adults are in their 30s), white families have 3.5 to 4 times the wealth of families of color. As adults age these initial racial differences grow both absolutely and relatively. Whites in the cohort we examined started with about three and a half times more wealth than blacks in their 30s but had seven times more wealth in their 60s. Compared with Hispanics, whites had four times more wealth in their 30s but nearly five times more wealth three decades later.
Or consider how ratios would vary if each family saved the same share of its income and earned the same rate of return on those savings. Ignoring inheritances, the wealth gap should resemble the income gap, not be three times as large.
While the Great Recession didn’t cause the wealth disparities between whites and minorities, it did exacerbate them. The 2007–09 economic slowdown brought about sharp declines in the wealth of white, black, and Hispanic families alike, but Hispanics experienced the largest decline. Lower net equity in homes accounts for much of Hispanics’ wealth loss, while retirement accounts are where blacks were hit hardest.
Something is definitely going on. Whatever other conclusions one may draw, I think our tax and social policies are doing a pretty poor job of helping individuals attain the types of protections that private wealth-holding offers. In fact, wealth disparities among races have expanded over the past 27 years, which should have liberals and conservatives alike questioning the unintended consequences of their policy victories, or at least their policy focus, over that period.
For more analysis of the wealth gap between whites and minorities, read the brief Less Than Equal: Racial Disparities in Wealth Accumulation or watch The Racial Wealth Gap in America. This work has been cited in the New York Times.
Should Social Security Taxes Affect All Wages? A Modest Rise Is Fine, but It’s Not a Panacea
Posted: April 19, 2013 Filed under: Economic Growth and Productivity, Income and Wealth, Shorts, Taxes and Budget 1 Comment »Arithmetic tells us we must either decrease the growth of Social Security spending or increase taxes as a share of gross domestic product.
But we should do it with an eye on fairness, growth and efficiency. We’re all in this together, so higher-income families must give up something to deal both with Social Security shortfalls and those in the budget more generally. A modest increase in the wage base for Social Security has some justification since that base has eroded in recent years. But if extended too far, it exacerbates the squeeze on other government programs. How? On the tax side, it tends to preempt other tax increases for non-Social Security purposes. On the benefit side, it attempts to maintain a growth rate of Social Security and other elderly programs that absorb more than all of the scheduled growth in government spending for decades to come, thus continuing a downward spiral in the share of the overall budget devoted to children, education and investment more generally.
Under current Social Security formulas, ending the cap on income would mean that some fairly wealthy individuals would get benefits in excess of $1 million. Though no one thinks that that makes sense as a benefit schedule, capping benefits goes against the Social Security tradition of being paid back for additional contributions. On the technical front, an unlimited Social Security tax would also encourage individuals to reclassify labor income as capital income not subject to Social Security tax. This would be a special problem for the self-employed and owners of partnerships, since Social Security now taxes both their capital and labor income as labor income.
Finally, the Social Security Administration’s Office of the Actuary found that even with a cap on benefits, the wage base expansion would still leave the program running future deficits. We shouldn’t pretend that it does otherwise.
This column was reposted from New York Time’s Room for Debate.
On Dementia, Cost-of-Living Adjustments, and the Right Way to Reform Programs for the Elderly
Posted: April 16, 2013 Filed under: Aging, Columns, Economic Growth and Productivity, Health and Health Policy, Income and Wealth, Taxes and Budget 4 Comments »While the increase in dementia among the elderly and the president’s proposal to change the index used to provide cost-of-living adjustments (or COLAs) to Social Security recipients have both received prominent headlines recently, the discussions have largely been independent of one another. Yet any principled attempt to reform our elderly programs, including Social Security, Medicare, and Medicaid long-term care, should consider them together.
A well-designed reform of elderly programs could and should accommodate some of the cost problems associated with dementia by back-loading a larger share of benefits in Social Security to older ages when these and other needs of old age increase. COLA adjustments, whatever their other merits, front-load the system by cutting back on benefits for the oldest the most and those in late middle age or their 60s hardly at all. That the president and Congress have limited ability to engage in these types of discussions and tackle multiple goals at the same time is yet one more example of how our political processes increasingly block us from fixing what ails us.
In a well-cited RAND study, Michael Hurd and his coauthors estimate that dementia-related care purchased in the marketplace will cost somewhere close to $0.25 trillion in 2040 (in 2010 dollars). That sounds like and is a lot of money, but Social Security and Medicare are expected to rise to cost over $3.5 trillion in that same year. Although I am greatly simplifying by ignoring such factors as how much of the $0.25 trillion would be covered by individuals and not the government or the effect of entitlement reform on costs, the raw comparison speaks for itself.
Simply put, some of the private and public budget problems associated with dementia, Alzheimer’s, and other growing problems for the older among the elderly could be addressed by providing higher cash benefits in older ages. Whatever the aggregate size of Social Security in general, one could pay for this reform by cutting back on benefits in younger ages of Social Security “old age insurance” receipt. This would not solve all the associated problems of dementia, but it would be a simple, effective, easy-to-administer step in the right direction. And, by concentrating benefits more in older ages, it would encourage working longer at a time when employment rates for the population as a whole are scheduled to decline.
But this is not the discussion we’re having. Instead, the president and many budget reformers put forward a proposal to adapt what many believe is a better measure of cost-of-living or price changes and apply it to almost all government programs, including Social Security. As a technical matter, a COLA adjustment doesn’t affect the growth in initial Social Security benefits for those who retire, only the inflation adjustment they get after they retire. At that point, they get a small annual cut—e.g. 3/10 of 1% the first year, 6/10 of 1% the second year, and so forth—that compounds every year in retirement, so that by the time beneficiaries are in their late 80s or 90s, some 25 or 30 years of lower COLAs add up to a cut in benefits of as much as 10 percent.
Social Security has never adjusted upward the earliest retirement age for increases in life expectancy. Instead, it reduced the earliest age from 65 to 62 in 1959 and 1962. As a consequence, the share of benefits going to those with 15 or more remaining years of expected receipt has risen dramatically over time, and the share to those with, say, less than 10 years of remaining life expectancy has declined. The COLA proposal, even with some very old age adjustments suggested by the president, would add to this long-term trend of making the program ever less available in relative terms for those in truly old age.
This is not to say that the COLA proposal should not be adopted. Who can oppose trying to measure something better? But attempts to fix systems like Social Security and other elderly programs one parameter or adjustment at a time cannot easily meet multiple worthwhile objectives. Similarly, efforts to back-load the system to meet the needs of true old age, as suggested here, should be coordinated with further adjustments—say, in minimum benefits—to avoid discriminating against those with shorter life expectancies.
With or without a better COLA, therefore, reform of Social Security and other elderly programs requires a more comprehensive approach if we are to meet the needs of old age as they evolve over time. Shouldn’t dementia be a higher priority than early retirement? If we’re going to spend $3 trillion or more annually on Social Security and Medicare by 2040, do we really think that the allocation of those funds be determined by formulas set in years like 1935 or 1965 or 1977, when much of the current system was cobbled together?
Any Way You Look at It, Young Americans Have Less Wealth than Their Parents
Posted: April 9, 2013 Filed under: Children, Economic Growth and Productivity, Income and Wealth, Race, Ethnicity, and Gender, Shorts 3 Comments »My colleagues and I recently published research showing that younger age groups are falling behind their parents in wealth accumulation and explaining the story behind our numbers. Some have raised questions about how we use our data, and I want to take some time to further explain our research.
Our study shows that the average wealth, or net worth, of these younger age groups has fallen fairly dramatically relative to older age groups. In response, some have said that median wealth is more important than average wealth. In fact, both are important. Average wealth tells us how a group is prospering as a whole relative to other groups; median wealth tells us how some “typical” person might be doing. One complication with focusing on median wealth is that it doesn’t show where all the remaining wealth goes. In a similar vein, if you were studying small business ownership by age or race, the median value might be zero for all groups. The average values would be greater than zero and thus would allow comparisons by groups.
Consider the median household age 56–64 in 2010. True, it is only slightly richer than the median household of a similar age in 1983 ($179,400 versus $143,150). Still, the median household age 29–37 in 1983 had $46,234 in wealth, but the median household in that age group in 2010 had only $15,900, less than half compared to their parents.
Median and average net worth by age is reported here. Come to your own conclusion.
Another footnote: Our study did not look at the decline in defined benefit wealth. However, the availability of such wealth has declined more for younger than older groups. Moreover, the valuation of defined benefits and annuities goes up for those who have them when interest rates go down. Older individuals with more defined benefit wealth technically saw the value of wealth go up after the Great Recession.
You can slice and dice these data in many ways, but the empirical data speak for themselves: younger age groups have fallen behind in relative terms. All sorts of factors are involved: the Great Recession and its impact on housing, student debt, wages, and so forth. Each is worthy of our attention.