Lost Generations? Wealth Building Among the Young
Posted: March 15, 2013 Filed under: Children, Columns, Economic Growth and Productivity, Income and Wealth, Race, Ethnicity, and Gender 19 Comments »The young have been faring poorly in the job market for some time now, a condition only exacerbated by the Great Recession. Now comes disturbing news that they are also falling behind in their share of society’s wealth and their rate of wealth accumulation.
Signe Mary McKernan, Caroline Ratcliffe, Sisi Zhang, and I recently examined how different age groups have shared in the rising net wealth of the U.S. economy. Despite the recent recession, our economy in 2010 was about twice as rich both in terms of average incomes and net worth as it was 27 years earlier in 1983. But not everyone shared equally in that growth.
Younger generations have been particularly left behind. Roughly speaking, those under age 46 today, generally the Gen X and Gen Y cohorts, hadn’t accumulated any more wealth by the time they reached their 30s and 40s than their parents did over a quarter-century ago. By way of contrast, baby boomers and other older generations, or those over age 46, shared in the rising economy—they approximately doubled their net worth.
Older Generations Accumulate, Younger Generations Stagnate
Change in Average Net Worth by Age Group, 1983–2010
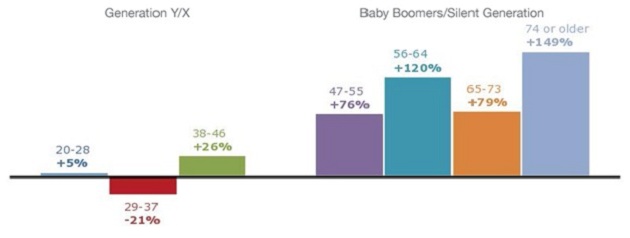
Source: Authors’ tabulations of the 1983, 1989, 1992, 1995, 1998, 2001, 2004, 2007, and 2010 Survey of Consumer Finances (SCF).
Notes: All dollar values are presented in 2010 dollars and data are weighted using SCF weights. The comparison is between people of the same age in 1983 and 2010.
Households usually add to their saving as they age, while income and wealth rise over time with economic growth. If these two patterns apply consistently and proportionately, then one might expect to see, say, a parent generation accumulate $100,000 by the time its members were in their 30s and $300,000 in their 60s, whereas their children might accumulate $200,000 by their 30s and $600,000 by their 60s.
This normal pattern no longer holds for the younger among us. However, this reversal didn’t just start with the Great Recession; it seems to have begun even before the turn of the century. The young increasingly have been left behind.
Potential causes are many. The Great Recession hit housing hard, but it particularly affected the young, who were more likely to have the largest balances on their loans and the least equity relative to their home values. If a house value fell 20 percent, a younger owner with 20 percent equity would lose 100 percent in housing net worth, whereas an older owner with the mortgage paid off would witness a drop of only 20 percent.
As for the stock market, it has provided very low returns over recent years, but those who hung on through the Great Recession had most of their net worth restored to pre-recession values. Bondholders usually came out ahead by the time the recession ended as interest rates fell and underlying bonds often increased in value. Also making out well were those with annuities from defined benefit pension plans and Social Security, whose values increase when interest rates fall (though the data noted above exclude those gains in asset values). Older generations hold a much higher percentage of their portfolios in assets that have recovered or appreciated since the Great Recession.
As I mentioned earlier, however, the tendency for lesser wealth accumulation among the younger generations has been occurring for some time, so the special hit they took in the Great Recession leaves out much of the story. Here we must search for other answers to the question of why the young have been falling behind. Likely candidates for their relatively worse status, many of which are correlated, include
- a lower rate of employment when in the workforce;
- delayed entry into the workforce and into periods of accumulating saving;
reduced relative pay, partly due to their first-time-ever lack of any higher educational achievement relative to past generations; - their delayed family formation, usually a harbinger and motivator of thrift and homebuilding;
- lower relative minimum wages; and
- higher shares of compensation taken out to pay for Social Security and health care, with less left over to save.
When it comes to conventional wisdom and media attention to distributional issues, there’s a tendency simply to attribute any particular disparity, such as the young falling behind in wealth holdings, to the growth in wealth inequality in society. But the two need not be correlated. Disparities can grow within both younger and older generations, without the young necessarily falling behind as a group.
Whatever the causes, we should also remember that public policy now places increased burdens on the young, whether in ever-higher interest payments on federal debts they will be left or the political exemption of older generations from paying for their underfunded retirement and health benefits. At the same time, state and local governments have given education lower priority in their budgets; pension plans for government workers now grant reduced and sometimes zero net benefits to new, younger hires; and homeownership subsidies post-recession increasingly favor the haves over the more risky have-nots.
Maybe, more than just maybe, it’s time to think about investing in the young.
Getting the Facts Straight on Retirement Age
Posted: March 12, 2013 Filed under: Aging, Columns, Economic Growth and Productivity, Income and Wealth, Race, Ethnicity, and Gender 16 Comments »On the front page of the Washington Post on March 11, 2013, Michael Fletcher connects the different life expectancies of the poor and rich to the debate over whether Social Security should provide more years of retirement support as people live longer. He mistakenly leaves the impression that adjusting the retirement age for increases in life expectancy hurts the poor the most. In fact, such adjustments take more away from the rich. Let me explain how.
Suppose I designed a government redistribution policy that increases lifetime Social Security benefits by $200,000 for every couple with above-average income that lives to age 62. For every couple with below-average income that reaches age 62, my program would increase benefits by $100,000.
Does this sound like a good policy? Well, that’s exactly what Social Security has done by providing all of us with increasing years of retirement support. People retiring today get many, many more years of Social Security benefits than those retiring when the system was first created. And, the primary beneficiaries are the richer, not the poorer, among us. Throwing money off the roofs of tall buildings would be a more progressive policy, since the poor would likely end up with a more equal share.
Why, then, do some Social Security advocates oppose increasing the retirement age? Because the $100,000 in my example could mean proportionately more money for the poor. For instance, it might add one-tenth to their lifetime earnings (of, say, $25,000 a year for 40 years of work, or $1 million over a lifetime), while the $200,000 to rich individuals might add only one-fifteenth to their lifetime earnings. As it turns out, even this assumption isn’t correct, but let’s assume for the moment it is.
Why would we want to redistribute that way? Following that logic, we should have protected the jobs of all the Wall Street bankers after the recent crash because their wages represented a smaller share of their income than the wages of poorer workers providing support services. Or perhaps we should provide $5,000 of food stamps to those making more than $50,000 and $3,000 of food stamps to those making $20,000; after all, the latter would still get proportionately more.
As it turns out, however, more years of retirement benefits don’t benefit the poor proportionately more than the rich. Yes, the poor have lower life expectancies, but other elements of Social Security offset this factor. A greater share of the poor doesn’t make it to age 62, so a smaller share of them benefit from expansions in years of retirement support. More importantly, those who are poorer are more likely to receive disability payments that aren’t affected one way or the other by the retirement age; hence, again, a significantly smaller share of them benefit from more retirement years. Other regressive elements such as spousal and survivor benefits also come into play for reasons I won’t further explain here. Empirically, these various factors add up in such a way that increases in years of benefits help those who are richer and those who are poorer in ways roughly proportionate to their lifetime incomes.
Setting these disputes aside, the higher mortality rate of the poor at each age does raise many legitimate policy issues. Recipients who stopped smoking a couple of decades ago, for instance, have been rewarded with more and more years of retirement benefits. This, along with many other features of Social Security, such as the design of spousal benefits already noted, does mean that the system is a lot less progressive than most believe.
The more fundamental issue, then, is whether we should better protect those with low-to-average wages during their lives. I believe we should but through better-targeted mechanisms, such as minimum benefits, progressive adjustments to the benefit formula, wage supplements to low-wage workers, and other devices that don’t spend most of the program’s funds on ever more years of retirement for those who are richer.
Yet another reason to worry about the retirement age is that the failure to adjust over time—a couple retiring today at 62 can now expect about 27 years of benefits—has meant larger shares of payments go to those closer to middle age, in terms of remaining life expectancy. Almost every year, a smaller share of payments goes to those who are truly old and more likely to need assistance.
In sum, the recent widening gap in life expectancy, likely due to such factors as differential rates of cigarette smoking, deserves serious attention. But let’s not pretend that throwing money off the roof, or providing more years of retirement support to the non-disabled who make it to age 62, addresses the core issue. There are better ways to compensate than converting a system originally designed to protect the old into one offering middle-age retirement to everyone.
Creative Ways Around a Blunt Sequester
Posted: February 27, 2013 Filed under: Columns, Income and Wealth, Taxes and Budget 5 Comments »I would like to offer two simple plans, one for Republicans and one for Democrats, to avoid a blunt, across-the-board sequester with no realistic assessment of priorities. Each plan gives both parties something they want without abandoning their core principles. Each also strengthens the party making the proposal by putting the other one on the spot if it fails to move toward a moderate compromise.
First, Republicans. They should offer to empower the president, within fairly broad limits, to reallocate the direct spending cuts required by sequester and include entitlements in the offer. Yes, they would cede some power over a relatively moderate share of total spending, but they would retain their primary goal: forcing Democrats to tackle the spending side of the budget.
Next, Democrats. They should replace their demand that the sequester include tax increases with a simpler demand that the rich pay a fair share of any burden. Yes, they would give up their requirement of balancing tax increases with spending cuts, but they would retain their more basic goal: maintaining or enhancing progressivity.
To understand why these strategies would work, we have to go back to the root causes of the impasse. Both parties are fiercely fighting to compel the other one to ask the middle class for the inevitable—to give up something, at least long term, to restore reasonable balance to the budget. Each party considers it political suicide to take the lead itself. Just think back to the presidential campaign, when each candidate indicated support for Medicare cuts, only to be viciously attacked by the other.
At the same time, both parties feel trapped and confused by years of mutual dissembling about subsidies that are put into the tax code.
Given that the American Tax Relief Act increased tax rates just last month, neither party is suggesting higher taxes. The debate now is over the tax base. Republican, Democratic, and independent economists all agree that subsidies in the tax code can be made to look just like direct spending. Therefore, any reasonable debate should be over whether all subsidies and spending programs work well and are worth every dime they cost, or whether they should be reformed—not on which side of the ledger they sit.
For Republicans, the subtext is that direct spending also needs to be tackled, and much of that direct spending lies in so-called mandatory or entitlement spending, which occurs automatically with no new vote required by Congress. The push to enact yet more “tax increases,” just after tax rate were raised, they consider unfair and imbalanced.
For Democrats, the subtext is that the rich have made out quite well in recent decades, so they should bear a significant portion of any deficit reduction. Excluding tax subsidies, which tend to be a bit more top-heavy and favor taxpayers with above-average incomes, they consider unfair and imbalanced.
As I noted, to an economist of any stripe, deciding which programs to fix according to the label we place on them—direct spending or tax subsidy—is silly. But this logic belies a long history where both Democrats and Republicans were quite happy increasing tax subsidies since they could then claim smaller government (through lower taxes) when they were actually increasing the scope of government activity (through more interference, along with deficits or higher tax rates to support the subsidies). Now that we have to cut back on automatic growth in direct spending, or tax subsidies, or (most likely) both, it’s harder to change the terms of the debate.
In truth, Republicans should be just as happy cutting back on tax subsidies as on direct spending, as both mean less government interference in the economy. By the same token, Democrats should be just as happy with direct spending cuts as with cuts in tax subsidies. Since Democrats, too, end up with smaller government either way, they should focus on progressivity, not the more semantic debate over cuts in tax subsidies versus direct subsidies.
That’s where my compromise proposals come in. If Republicans would simply empower the president to reallocate the spending cuts, then the bluntness of the sequester would be eliminated. Yes, they would be giving up some power, but come on, they control only one house of Congress. Look how they came out of the last debate, with only tax rate increases and a bloody nose to boot. Forcing the president to choose also enables Republicans to run later on how they would have chosen better. And if the president really cares about progressivity, he should want to extend those cuts to entitlements, many of which also provide more benefits to the rich than the poor.
As for Democrats, why not aim their sights at their real target: progressivity? If the Republicans would allocate spending cuts as progressively as the Democrats could ever expect tax base increases to come out, then they, too, will have achieved their principal objective. Moreover, if Republicans couldn’t balance the burden of deficit reduction with spending cuts alone, they would be forced to admit that they have to go to the tax code to search for additional options, including tax subsidies.
A similar type of compromise might also be used to change the timing of the sequester, an issue beyond the scope of this brief column.
Simply put, to move beyond budgetary impasses, each party must figure out what it can give up to get what it really wants, while putting the other party on the spot for not responding to a reasonable offer of compromise. Neither of my suggestions is perfect, by any means, but I think either one or both could remove the bluntness of the sequestration.
How Tax and Transfer Policies Affect Work Incentives
Posted: February 14, 2013 Filed under: Economic Growth and Productivity, Income and Wealth, Job Market and Labor Force, Shorts, Taxes and Budget 1 Comment »When the design of safety net programs is considered alongside that of our tax code, it is easy to see that our tax and transfer systems need to focus less on increasing consumption and more on promoting opportunity, work, saving, and education.
The government doesn’t affect work incentives just through direct taxes. Implicit taxes—that is, penalties for earning additional income—are everywhere, whether in TANF or SNAP, Medicaid or the new health exchange subsidy, PEP or Pease (reductions in tax allowances for personal exemptions and itemized deductions), Pell grants or student loans, child tax credits or earned income tax credits, unemployment compensation or workers compensation, or dozens of other programs. These implicit taxes combine with explicit taxes to create inefficient and often inequitable, certainly strange and anomalous, incentives for many households.
At some income levels, families face prohibitively high penalties for moving off assistance. Accepting a higher paying job could mean a steep cut in child care assistance for a single worker with children, for instance. For some, the rapid phaseout of benefits can offset or even more than offset additional take-home pay. Asset tests in means-tested programs create similar barriers to saving.
Not getting married is one way that people avoid some of these penalties or taxes and is the major tax shelter for low- and moderate-income households with children. Our tax and welfare system thus favors those who consider marriage an option—to be avoided when there are penalties and engaged when there are bonuses. The losers tend to be those who consider marriage a social or religious necessity.
The high rates and marriage penalties arising in these systems occur partly because of the piecemeal fashion in which they are considered. Efforts to design benefit packages more comprehensively could greatly improve both the incentives families face and the quality and choice of benefits they receive.
For more details, see my congressional testimony for today’s hearing on “Unintended Consequences: Is Government Effectively Addressing the Unemployment Crisis?” before the Committee on Oversight and Government Reform.
What the Public Doesn’t Understand About Social Security and Medicare
Posted: January 30, 2013 Filed under: Aging, Health and Health Policy, Income and Wealth, Shorts, Taxes and Budget 6 Comments »An earlier short highlighted my research with Caleb Quakenbush into how much people pay in Social Security and Medicare taxes over a lifetime, and how much they receive in benefits. For instance, we found that a two-earner couple making an average wage who turned 65 in 2010 would have paid $722,000 in Social Security and Medicare taxes over their lifetimes, but would receive $966,000 in benefits.
These types of numbers often generate outraged debate over how much seniors are “owed” based on what they “paid in” to Social Security and Medicare.
But there is another, more philosophical, issue that these numbers cannot address. Americans do not pay their taxes into a personal account that they can take out, plus interest, when they retire. The money paid into Social Security and Medicare has always been chiefly paid out immediately to older generations. The only exception has been some trust funds which have always been modest in size and are shrinking. Thus, Social Security is effectively a transfer system from young to old, and always has been.
We may feel that because we transferred money to our parents, our kids, in turn, owe us. But we must take into account also how much they can or should afford for this task as opposed to their own current needs for themselves and their children. Think of a one-family society, where three kids support their parents, but then those three kids have no children of their own (or only one or two children). What those three kids gave their parents informs us only slightly on what they can or should get from their own children if there are none or fewer of them. Likewise, when demographics change and there are fewer workers to support an aging population, society has to make adjustments, regardless of what some may otherwise think is “fair” or what they think is their entitlement.
For articles inspired by this research, see a recent PolitiFact.
Henry Ford, the American Experience, and Why and How the Distribution of Income Affects Growth in the Modern Economy
Posted: January 29, 2013 Filed under: Columns, Economic Growth and Productivity, Income and Wealth 3 Comments »One hundred years ago Henry Ford dropped the price of his Model T to $550. Having adopted new and successful engineering and assembly techniques, the company’s sales expanded exponentially, approximately tripling between 1911 and 1914 alone. Henry Ford bragged that his car would be “so low in price that no man making a good salary will be unable to own one.”
On the American Experience (January 29, 2013) PBS covers the biography of Henry Ford. That story has application to our own time in explaining how the distribution of income affects economic growth.
Ever since the Industrial Revolution, economies of scale—mass production with lower cost for the last items produced than for the first—have been the primary engine of income growth for nations and workers. Ford’s talent at mass production not only made him extraordinarily rich, it helped increase the effective incomes of workers throughout the country since their earnings could go farther. While massive rewards did accrue to entrepreneurs, inventors, and those gaining temporary monopolies, the rising tide lifted all boats; it even leveled out the gains as the forces of competition limited how much leading capitalists could garner for their efforts of yesteryear.
Henry Ford’s fight with unions to the side, he did recognize from the start that workers needed to earn enough to buy his products. I’m not suggesting that the cart of workers’ incomes leads the horse of profits, but rather that they move forward together. Ford at least knew that he and some of the other rich people he tended to detest could use only so many cars themselves; if the everyday citizen couldn’t buy them, he could never get rich.
So how did we move toward a society where today profits seem to be rising but workers’ incomes remain stagnant? The main answer, I believe, is that while economies of scale have expanded extraordinarily since Ford’s day, the necessary purchasers of the new products lie within a global economy. The growth of U.S. workers’ incomes is less necessary for the producers of new goods and services to become wealthy.
Consider how many modern-day Henry Fords produce goods and services with limited physical content: pharmaceutical drugs, electronic software, technology, movies, and other forms of entertainment and information. These “industries” provide much of the growth of the modern U.S. economy.
Many products within these growth industries can be produced at almost no cost for the next or marginal purchaser. How much does it cost Hollywood producers to let one more person watch a movie? For the drug manufacturers to produce one more pill? For Microsoft or Apple to make software available to one more person? Almost nothing in many cases, other than marketing. As economies of scale expanded as we moved through the 20th to the 21st century, so, too, have the possibilities for growth when more people have enough money to buy these new products. If the costs of a pill or movie can be shared among 10 million people, rather than 1 million, then the world economy can expand quickly when 9 million more people can afford to buy the product.
These economies extend beyond production to transportation, storage, and similar costs. It doesn’t cost much to “transport” a movie to Monaco, a pill to Paris, or software to Sofia.
Modern capitalists seek their buyers within a world population of 7 billion, not a U.S. population of 300 million. When creating products with extraordinary economies of scale that are easily transportable, at low weight or even with the click of a mouse button, the new American entrepreneur still wants purchasers whose incomes rise enough to buy these new goods and services. It’s just less necessary that those purchasers reside in the United States.
Does this mean that income becomes increasingly unequal? It depends partly upon whom you count and what type of measure you use. Almost no one could have guessed even a few decades ago the rise of hundreds of millions of middle-class people in China and India. At the same time, it’s also possible that incomes will rise initially for U.S. and Indian entrepreneurs and for workers in Bangalore, but not for large portions of the population in either the United States or India.
I am not arguing that all the consequences of this world order are sanguine. But only by defining its characteristics can we identify our opportunities.
First, consider how substantial economies of scale make higher growth rates possible when incomes rise across the board. Productivity just doesn’t rise as quickly when we build and subsidize McMansions for the few rather than employ workers to provide goods and services with greater economies of scale for the many.
Similar calculations can affect welfare policy. It may not cost us very much directly to give lower-income people the ability to buy goods and services with large economies of scale. For instance, if we give a household $1,000 that it uses to buy a television subscription that at the margin costs a cable company only an additional $100 to provide, then the net cost to the non-welfare part of society may also be only $100 despite the transfer of $1,000. At the same time, if the $1,000 subsidy at a $100 marginal cost of production results in plus $900 to a monopoly cable company and minus $1,000 to the taxpayer, then both the welfare recipient and the taxpayer may have reduced incentive to work. Private income (before welfare) also becomes more unequal.
Or consider antitrust policy. Tying it to its 19th century moorings may be inadequate for a 21st century economy. International competition may lessen any concern over having only four major American automobile manufacturers, but what about the concentration of accounting practices among the Big Four? Did the breakup of Arthur Andersen for its accounting indiscretions promote or reduce competition?
What about our current multi-tiered pricing of drugs, higher at home and lower abroad? Without any compensating mechanism, does this increase net output from the United States but at an unfair cost to U.S. consumers?
To answer all these questions, we need to concentrate correctly on causes, not inveigh interminably on impressions. One conclusion from Henry Ford’s day still stands out in my mind: promoting greater growth means both a favorable climate for entrepreneurship and a sharing of its rewards broadly with workers.
Retired Couples Receiving More Years of Support under Social Security
Posted: January 18, 2013 Filed under: Aging, Income and Wealth, Shorts, Taxes and Budget 3 Comments »Increased time spent in retirement is a driving factor behind rising Social Security and Medicare costs. A couple that stopped working at the earliest Social Security retirement age in 1940 would expect to receive 19 years of retirement benefits; a similar couple in 2010 would expect 28 years of benefits. By 2080, couples could be receiving retirement support for 33 years.
This calculation assumes both partners are the same age and will have average life spans. Partners of different ages and those (often higher-income) couples who expect to live longer, such as nonsmokers, receive even more years of support.
As it turns out, these many years in retirement affect more than Social Security balances. Retiring longer also reduces the share of Social Security benefits spent on recipients in their last (e.g., ten) years of life and the income tax revenues to support other government functions.
Expected Years of Retirement Benefits, Earliest Year of Retirement
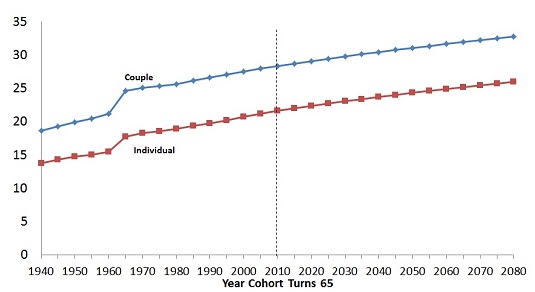
C. E. Steuerle and S. Rennane, Urban Institute 2010. Calculations based on mortality data from the 2010 OASDI Trustees’ Report.
Assumption: in a couple, at least one partner is still living. ERA was set at 62 for women in 1956 and men in 1961.
For more on this topic, see Correcting Labor Supply Projections for Older Workers Could Help Social Security and Economic Reform.
Social Security & Medicare Lifetime Benefits
Posted: November 5, 2012 Filed under: Aging, Health and Health Policy, Income and Wealth, Shorts 6 Comments »How much will you pay in Social Security and Medicare taxes over your lifetime? And how much can you expect to get back in benefits? It depends on whether you’re married, when you retire, and how much you’ve earned over a lifetime.
I recently published with Caleb Quakenbush “Social Security and Medicare Taxes and Benefits Over a Lifetime: 2012 Update” which updates previous estimates of the lifetime value of Social Security and Medicare benefits and taxes for typical workers in different generations at various earning levels based on new estimates of the Social Security Actuary. The “lifetime value of taxes” is based upon the value of accumulated taxes, as if those taxes were put into an account that earned a 2 percent real rate of return (that is, 2 percent plus inflation). The “lifetime value of benefits” represents the amount needed in an account (also earning a 2 percent real interest rate) to pay for those benefits. Values assume a 2 percent real discount rate and all amounts are presented in constant 2012 dollars.
While no major changes in Social Security or Medicare law have occurred since the last update, these estimates reflect alternative assumptions provided by the Center for Medicare and Medicaid Services (CMS) actuaries that lawmakers will cancel a draconian scheduled cut in Medicare payment rates to physicians and other scheduled spending reductions. The result is significantly higher projected lifetime Medicare benefits than current law assumptions would indicate.
Below is a sample table from the brief, for a two-earner couple both earning Social Security’s average wage measure. This set of calculations assumes that workers retire at age 65.
| Two-Earner Couple: Average Wage ($44,600 each in 2012 dollars) | |||||||
| Year cohort turns 65 | Annual Social Security benefits | Lifetime Social Security benefits | Lifetime Medicare benefits | Total lifetime benefits | Lifetime Social Security taxes | Lifetime Medicare taxes | Total lifetime taxes |
| 1960 | 19,000 | 264,000 | 41,000 | 305,000 | 36,000 | 0 | 36,000 |
| 1980 | 30,800 | 461,000 | 151,000 | 612,000 | 196,000 | 17,000 | 213,000 |
| 2010 | 35,800 | 579,000 | 387,000 | 966,000 | 600,000 | 122,000 | 722,000 |
| 2020 | 37,800 | 632,000 | 427,000 | 1,059,000 | 700,000 | 153,000 | 853,000 |
| 2030 | 41,200 | 703,000 | 664,000 | 1,367,000 | 808,000 | 180,000 | 988,000 |
More background information on these calculations can be found at: http://www.urban.org/socialsecurity/lifetimebenefits.cfm.