How Earnings Affect Benefits for Households with Children: The Extreme Welfare Case
Posted: November 1, 2012 Filed under: Children, Income and Wealth, Shorts, Taxes and Budget 4 Comments »In theory, a household may be eligible for a broad range of government supports. Some are universally available, such as earned income tax credits and SNAP (formerly called food stamps) to a household with children if earnings are low enough. (See a previous short on this subject.) Others are only available to some people. For instance, government establishes waiting lists for programs like rental housing subsidies and limits number of years of participation in the traditional welfare program, now called Temporary Assistance to Needy Families or TANF.
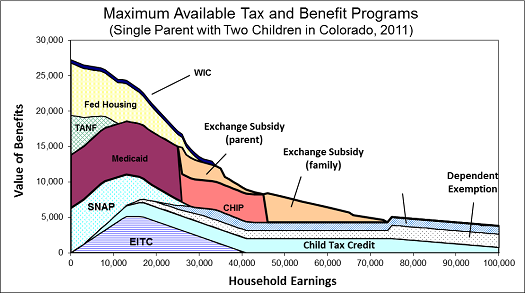
The figure below assumes a single parent with two children is receiving almost all these benefits, an extreme case. It includes the more universally available programs, like SNAP. It also assumes the availability of the new Exchange subsidy provided by health reform. Benefits add up to close to $27,000 when this household fails to work and fall to about $8,000 as earnings increase to $40,000. Note that the graph does not take into account free child care support or income and Social Security taxes. When these are added to other benefit reductions, the household can sometimes even lose net income by earning more.
For further detail see my testimony before the House Subcommittees on Human Resources and Select Revenue Measures on June 27, 2012, “Marginal Tax Rates, Work, and the Nation’s Real Tax System.”
How Earnings Affect Benefits for Households with Children: The More Universal Case
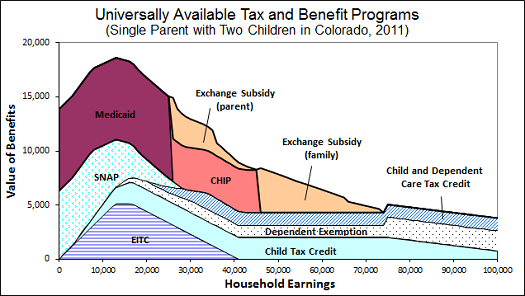
Posted: October 31, 2012 Filed under: Children, Income and Wealth, Shorts, Taxes and Budget 5 Comments »Many government programs automatically grant eligibility to all families with children, depending only on their income. As their incomes increase, however, these families often, but not always, receive fewer benefits. Some restrictions operate on a schedule: earn $1 more, get 30 cents less in benefits. Medicaid provides eligibility up to a given income level, then denies eligibility when one more dollar is earned (though usually with a delay). The dependent exemption only is available to those owing taxes, and only at high income levels is removed by the alternative minimum tax.
How do these programs interact?
The figure below considers a single parent household with children and shows how these various benefits vary as the earnings of the household increase. Because every household with children, including you and me if we are raising children, is eligible for these programs if our income falls in the right ranges, we can be said to belong to this benefit and benefit reduction system. For instance, as income increases from $10,000 to $40,000, our household would lose most earned income tax credits, SNAP (formerly known as food stamps), and much Medicaid, though under health reform other health subsidies would still be available. Note that in addition to these losses of benefits, direct tax rates from income and Social Security taxes would apply, though they are not shown here. For further detail see my testimony before the House Subcommittees on Human Resources and Select Revenue Measures on June 27, 2012, “Marginal Tax Rates, Work, and the Nation’s Real Tax System.” My next short describes the extreme welfare case.
The 1 Percent (Political) Solution
Posted: September 13, 2012 Filed under: Columns, Income and Wealth, Taxes and Budget 3 Comments »Political campaigns, particularly modern ones, tend to revolve around promises. That’s as true of Republicans offering tax cuts as Democrats promising to maintain or increase spending programs. When you see candidates from both parties visiting regions hit by hurricanes or drought, you can be sure they are trying to indicate how much they care for those affected. When politicians do venture onto the other side of the balance sheet — how they will pay for all past and current promises — they move much more gingerly.
A candidate for office effectively divides the population into the “deserving,” who should get more benefits or tax cuts (or at least should not pay more taxes or lose benefits), and the “undeserving,” who are not carrying their own weight. But he or she doesn’t want to put very many people in the latter category, since their votes likely will be lost.
That’s where the 1 percent solution comes in.
For Democrats, the 1 percent is the wealthy. President Obama stakes a lot of his campaign on going after those with incomes over $250,000. Many Congressional Democrats often won’t go that far; they confine their attacks and suggested tax increases to those making over $1 million.
For Governor Romney, the latest 1 percent is welfare recipients. Because the Obama administration recently granted waivers from work requirements to some states, more adults can now get benefits without even trying to work, the Romney campaign claims.
OK, “1 percent” is approximate. For you fact checkers, Tax Policy Center calculations indicate that the number of households facing tax increases under the president’s $250,000 threshold (slightly less for single people) is less than 1½ percent of tax units, and the number making more than $1 million (there’s really no specific tax plan to estimate against) is probably only about ⅓ of 1 percent.
Meanwhile, adult recipients of Temporary Assistance for Needy Families, the program most identified with welfare, make up less than 1 percent of all adults in the country; household recipients make up slightly over 1½ percent of all households, though only a fraction of those at best would be affected by any state waivers.
The point here is that depending upon how you count, each party is still trying to pander to between 98½ and 99⅔ percent of us, leaving most of us out of the cost side of the equation. Unfortunately for the country, the nation’s fiscal challenges confront us all!
Perhaps some of us count ourselves as moderates because we would be so bold as to tackle our budget situation by going after both the rich and the welfare recipients. We might find sympathy with the Occupy Wall Street and Tea Party crowds at the same time.
There’s one tiny complication. Almost everyone receives significant benefits from government, and most pay significant taxes relative to their income, although how they do so (income, social insurance, state, local, fees) varies by the individual. At the end of the day, the middle 98 or 99 percent gets most government benefits and pays most government taxes.
So when the federal government collects only 60 cents for every dollar it spends, it is relatively easy for almost everyone to agree that that situation is both economically untenable and arithmetically unsustainable. It is much harder for us to admit that the problem cannot be solved by targeting the 1 percent on either end of the income scale and that we, too, have to chip in.
During a campaign, I don’t want or expect politicians to identify whose taxes would be increased or benefits cut. Such actions would be political suicide and unrealistic, to say the least. Broad-based reform requires more thoughtful analysis than is possible in an electoral process dominated by sound bites and tweets.
Campaigns and politicians, however, should at least identify the types of structures they would construct. God forbid that their media consultants tell them how to specify, piecemeal, the plumbing, engineering and architecture of governance involved. I simply want those running for office to admit that government taxes and spending programs fundamentally have to be restructured in ways that are likely to ask something from all of us, not just 1 or 2 percent.
Like many voters, I’m also tired of being pandered to. I know that political advisers and media consultants like to tell the candidates that they must make their supporters feel superior to the “undeserving” who cause all our problems. Maybe such advice is savvy when it comes to obtaining power or winning each party’s nomination. Given how sticky the polls have remained for both candidates in this race, however, I rather doubt its effectiveness in a general election.
And to what ultimate purpose? Elected officials find it hard to govern these days because, in fact, they have just been elected by treating most of us voters as if we are both selfish and stupid.
More and more Americans have tired of that message. We desperately seek and need leaders who will provide a road map for a mutual journey forward, one that makes progress because we, not just 1 percent of others, share in the load.
This column was originally published by the GailFosler Group LLC and is reposted with permission.
Should State Pension Plans Play Wall Street With Employees’ Money?
Posted: August 1, 2012 Filed under: Aging, Income and Wealth, Shorts, Taxes and Budget 2 Comments »In a recent examination of state pension plans, my colleagues and I discovered that states are increasingly tempted to solve their underfunded pension plan problems by acting a bit like Wall Street: hoping to make money out of the deposits they hold in a fiduciary capacity for their employees.
When a state plan has inadequate funding to pay promised benefits, someone eventually has to cover the difference. It could be taxpayers, those in the plan, or those who will be in the plan.
Because current and future taxpayers are already on the hook for a lot of past bills that have been left to them, states have tried to reduce their potential burden. Because existing state employees, especially those near retirement, have made plans for the benefits they have been promised, they have been asked to give up only a little. In many cases, their additional cost is confined to higher employee contributions for the remaining years of their careers only. Since the other two groups have been spared much of this burden, new employees have been asked to pay significantly more in both higher lifetime contributions and lower lifetime benefits than existing employees.
In our examination of one example, a reformed New Jersey plan, it turns out that many or most newly hired employees are unlikely to get lifetime benefits from the plan that are any higher than what they could earn with a modest interest rate—say, 2 or 3 percent—on their own contributions. Only those who work for the state for a very long time, such as 25-year-olds who stay between 30 and 40 years, get more.
The plan, however, assumes actuarially that the state will still earn a return of 8¼ percent on those employee contributions. In effect, the state hopes to make money out of their employee contributions just like a bank or Wall Street does: by leveraging up deposits, borrowing at one rate, and earning money at a higher rate.
A number of economists, actuaries, and accountants (see, for instance, Joshua Rauh and Robert Novy-Marx, Andrew Biggs, and, most recently, the Government Accounting Standards Board) have questioned the assumption of such a high rate of return.
We raise a further issue. Whatever the appropriate rate, how much should a state depend upon future employees to be net contributors to a pension plan, rather than net beneficiaries from it?
State Pension Reform: Is There a Better Way?
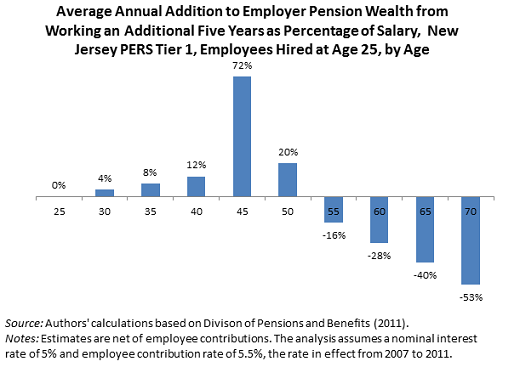
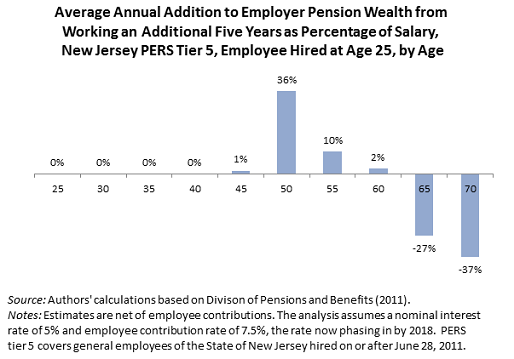
Posted: July 26, 2012 Filed under: Aging, Income and Wealth, Race, Ethnicity, and Gender, Shorts 1 Comment »Are the benefits of state pension plans allocated efficiently and fairly, and do they attract the best workers for the amount of money spent? Consider the graphs below for the state of New Jersey, which are somewhat typical of state pension plans in many other states. They show the annual pension wealth increments provided by the state for working for the state for five additional year for typical tier-1 (pre-reform) and tier 5 (post-reform) employees hired at age 25. Younger workers used to get very little, now they get nothing. Middle age workers get locked into the employment, regardless of how well it fits their skills or the needs of the state at that point. And older workers get very negative benefits, though at later ages than in the pre-reform era. For further details, see a paper (and two briefs) I published with Richard W. Johnson and Caleb Quakenbush, entitled “Are Pension Reforms Helping States Attract and Retain the Best Workers?”
Testimony on Drivers of Intergenerational Mobility and the Tax Code
Posted: July 10, 2012 Filed under: Children, Income and Wealth, Shorts, Taxes and Budget 2 Comments »On July 10, 2012, I testified before the Senate Finance Committee on “Mobility, the Tax System, and Budget for a Declining Nation,” available online here. Below is a shorter summary of my testimony.
Nothing so exemplifies the American Dream more than the possibility for each family to get ahead and, through hard work, advance from generation to generation.
Today mobility across generations is threatened by three aspect of current federal policy:
- a budget for a declining nation that promotes consumption ever more and investment, particularly in the young, ever less;
- relatively high disincentives to work and saving for those who try to move beyond poverty level income; and
- a budget that generally favors mobility for those with higher incomes, while promoting consumption but discouraging mobility for those with lower incomes.
Let me elaborate briefly.
First, in many ways, we have a budget for a declining nation.
Even if we would bring our budget barely to a state of sustainability—a goal we are far from reaching right now—we’re still left with a budget that allocates smaller shares of our tax subsidies and spending to children, and ever-larger shares to consumption rather than investment.
Right now the federal government is on track to spend about $1 trillion more annually in about a decade. Yet federal government programs that might promote mobility, such as education and job subsidies or programs for children, would get nary a dime. Right now, these relative choices are reflected in both Democratic and Republican budgets.
Second, consider that one of the main ways that part of the population rises in status relative to others is by working harder and saving a higher portion of the returns on its wealth. Discouraging such efforts can reduce the extent of intergenerational mobility.
One way to look at the disincentives facing lower-income households is to consider the effective tax rates they face, both from the direct tax system and from phasing out benefits from social welfare programs. After reaching about a poverty level income, these low- to moderate-income households often face marginal tax rates of about 50 or 60 percent or even 80 percent when they earn an additional dollar of income.
Third, in a study I led for the Pew Economic Mobility Project, we concluded that a sizable slice of federal funds—about $746 billion or $7,000 per household in 2006—did go to programs that arguably try to promote mobility. Unfortunately 72 percent of this total comes mainly through programs such as tax subsidies for homeownership and other saving incentives that flow mainly to middle- and higher-income households. Moreover, some of these programs inflate key asset prices such as home prices. That puts these assets further out of reach for poor or lower-middle-income households, or young people who are just starting their careers. Thus, programs not only neglect the less well-off, they undermine their mobility.
Finally, a note about some current opportunities. Outside education and early childhood health, if Congress wishes to promote mobility of lower-income households, as well as protect the past gains of moderate- and middle-income households that are now threatened, almost nothing succeeds more than putting them onto a path of increasing ownership of financial and physical capital that can carry forward from generation to generation.
Two opportunities, largely neglected in today’s policy debates, may be sitting at our feet.
First, rents have now moved above homeownership costs in many parts of the country. Unfortunately, we seem to have adopted a buy high, sell (or don’t buy) low homeownership policy for low- and moderate-income households.
Second, pension reform is a natural accompaniment and add-on to the inevitable Social Security reform that is around the corner.
I hope you will give some consideration to these two opportunities.
In conclusion, the hard future ahead for programs that help children, invest in our future, and promote mobility for low- and moderate-income households does not necessarily reflect the aspirations of our people or of either political party.
Testimony on Marginal Tax Rates and Work Incentives
Posted: July 9, 2012 Filed under: Economic Growth and Productivity, Income and Wealth, Shorts, Taxes and Budget 2 Comments »On June 27, 2012 I testified before the House Subcommittees on Human Resources and Select Revenue Measures on the interaction of various welfare and tax credit programs and work incentives. My full testimony, “Marginal Tax Rates, Work, and the Nation’s Real Tax System” can be found here, and the entire hearing can be watched online here. Below is a shorter summary of my remarks.
The nation’s real tax system includes not just the direct statutory rates explicit in such taxes as the income tax and the Social Security tax, but the implicit taxes that derive from phasing out of various benefits in both expenditure and tax programs. These “expenditure taxes,” as I call them, derive largely from a liberal-conservative compromise that emphasizes means testing as a way of both increasing progressivity and saving on direct taxes needed to support various programs. Although low- and moderate-income households are especially affected, you can’t turn around today without spotting these hidden taxes in Pell grants, the AMT, and in dozens, if not hundreds, of programs.
At the Urban Institute we have done quite a bit of work on calculating these rates. One case study we examined was a single parent with two children in Colorado in 2011, to find the maximum benefits for which such a person may be eligible and how they phase out as income increases. (Our net income change calculator (NICC) is now available on the WEB site and can demonstrate tax rates for families in a variety of circumstances in every state.) Rates are low or negative up to about $10,000 to $15,000 of income. Thereafter, they rise quickly. We also looked at the effective tax rate for a household whose income rises from $10,000 to $40,000, and found that income and payroll taxes take away about 30 percent of earnings. The phase out of universally available benefits such as EITC and SNAP or food stamps raises the rate to about 55 percent, and the household getting maximum subsidies, such as welfare and housing, sees a rate of about 82 percent. What used to be called a poverty trap has now moved out to what Linda Giannarelli and I have labeled the “twice poverty trap.” That is, the high rates especially hit households that earn more than poverty level incomes.
Many studies have attempted to show that the effect of these rates on work, and the results are mixed. Work subsidies such as the EITC generally encourage labor force participation but may tend to discourage work at higher income levels, particularly for second jobs in a family or moving to full time work. Design matters greatly. For instance, Medicaid will discourage work among the disabled more than a subsidy system such as the exchange subsidy adopted in health reform; on the other hand, health reform will probably encourage more people to retire early. For the same amount of cost, a program that requires work will indeed lead to more work than one that does not. EITC and welfare reform have done better on the work front than did AFDC.
Other consequences must be examined. Means testing and joint filing have resulted in hundreds of billions of dollars of marriage penalties for low and middle income households. Not marrying is the tax shelter for the poor. Many programs do help those with special needs, although they vary widely in their efficiency and effectiveness. There is some evidence that well-developed programs can improve behaviors such as school attendance and maternal health. At the same time, long-run consequences are often hard to estimate.
Just as a classic liberal-conservative compromise got us to this situation, so might it require a liberal-conservative consensus get us out of it. Among the many approaches to reform are (a) seeking broad-based social welfare reform rather than adopting programs one-by-one with multiple phase-outs, (b) starting to emphasize opportunity and education over adequacy and consumption; (c) putting tax rates directly in the tax code to replace implicit tax rates, (d) making work an even stronger requirement for receipt of various benefits, (e) adopting a maximum marginal tax rate for programs combined, and (f) letting child benefits go with the child and wage subsidies go with low-income workers rather than combining the two.
Declines in Wealth and Declines in Income
Posted: June 26, 2012 Filed under: Economic Growth and Productivity, Income and Wealth, Shorts 1 Comment »The press recently had a field day reporting the decline in wealth from 2007 to 2010, as measured by a recently released Survey of Consumer Finances. Be careful interpreting those results. A decline in the valuation of wealth does not necessarily mean any decline in collective well-being or consumption in a society.
Think of a decline in the price of gold. Society doesn’t necessarily consume any less of anything, and the loss for the gold seller is a gain for the gold buyer. More relevant to the current crisis, take the value of a house. It doesn’t produce any fewer services just because it sells for less. And the buyer gains what the seller loses. A retiree’s hope for selling and then spending down those assets in retirement may be reduced, but his children’s earnings go a lot further if they decide to buy a house.
There are, of course, real and agonizing losses from a recession. They largely come from the decline in output of society and of the corresponding income of its citizens. There are too many unemployed and underemployed resources, both people and capital. When a decline in society’s aggregate wealth reflects a reduction in the collective value of all the future things it can produce or buy—for instance, because factories produce less—then there are total net losses that are never recovered. Even here, however, one must distinguish between when the decline in wealth valuation occurs and when the losses to society really take place. Greece’s economy, for example, was long on a downhill curve, which the markets finally realized. In fact, if the reform effort succeeds, Greek citizens may end up with a more, not less, wealthy economy than they had when stocks and bonds started tumbling downward.

