Social Security & Medicare Lifetime Benefits
Posted: November 5, 2012 Filed under: Aging, Health and Health Policy, Income and Wealth, Shorts 6 Comments »How much will you pay in Social Security and Medicare taxes over your lifetime? And how much can you expect to get back in benefits? It depends on whether you’re married, when you retire, and how much you’ve earned over a lifetime.
I recently published with Caleb Quakenbush “Social Security and Medicare Taxes and Benefits Over a Lifetime: 2012 Update” which updates previous estimates of the lifetime value of Social Security and Medicare benefits and taxes for typical workers in different generations at various earning levels based on new estimates of the Social Security Actuary. The “lifetime value of taxes” is based upon the value of accumulated taxes, as if those taxes were put into an account that earned a 2 percent real rate of return (that is, 2 percent plus inflation). The “lifetime value of benefits” represents the amount needed in an account (also earning a 2 percent real interest rate) to pay for those benefits. Values assume a 2 percent real discount rate and all amounts are presented in constant 2012 dollars.
While no major changes in Social Security or Medicare law have occurred since the last update, these estimates reflect alternative assumptions provided by the Center for Medicare and Medicaid Services (CMS) actuaries that lawmakers will cancel a draconian scheduled cut in Medicare payment rates to physicians and other scheduled spending reductions. The result is significantly higher projected lifetime Medicare benefits than current law assumptions would indicate.
Below is a sample table from the brief, for a two-earner couple both earning Social Security’s average wage measure. This set of calculations assumes that workers retire at age 65.
| Two-Earner Couple: Average Wage ($44,600 each in 2012 dollars) | |||||||
| Year cohort turns 65 | Annual Social Security benefits | Lifetime Social Security benefits | Lifetime Medicare benefits | Total lifetime benefits | Lifetime Social Security taxes | Lifetime Medicare taxes | Total lifetime taxes |
| 1960 | 19,000 | 264,000 | 41,000 | 305,000 | 36,000 | 0 | 36,000 |
| 1980 | 30,800 | 461,000 | 151,000 | 612,000 | 196,000 | 17,000 | 213,000 |
| 2010 | 35,800 | 579,000 | 387,000 | 966,000 | 600,000 | 122,000 | 722,000 |
| 2020 | 37,800 | 632,000 | 427,000 | 1,059,000 | 700,000 | 153,000 | 853,000 |
| 2030 | 41,200 | 703,000 | 664,000 | 1,367,000 | 808,000 | 180,000 | 988,000 |
More background information on these calculations can be found at: http://www.urban.org/socialsecurity/lifetimebenefits.cfm.
How Earnings Affect Benefits for Households with Children: The Extreme Welfare Case
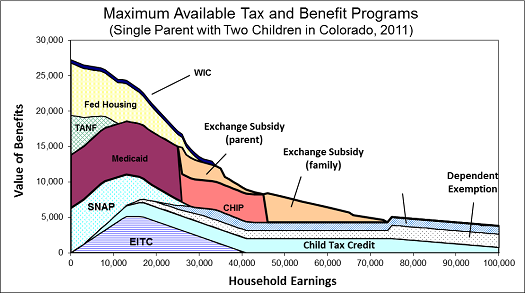
Posted: November 1, 2012 Filed under: Children, Income and Wealth, Shorts, Taxes and Budget 4 Comments »In theory, a household may be eligible for a broad range of government supports. Some are universally available, such as earned income tax credits and SNAP (formerly called food stamps) to a household with children if earnings are low enough. (See a previous short on this subject.) Others are only available to some people. For instance, government establishes waiting lists for programs like rental housing subsidies and limits number of years of participation in the traditional welfare program, now called Temporary Assistance to Needy Families or TANF.
The figure below assumes a single parent with two children is receiving almost all these benefits, an extreme case. It includes the more universally available programs, like SNAP. It also assumes the availability of the new Exchange subsidy provided by health reform. Benefits add up to close to $27,000 when this household fails to work and fall to about $8,000 as earnings increase to $40,000. Note that the graph does not take into account free child care support or income and Social Security taxes. When these are added to other benefit reductions, the household can sometimes even lose net income by earning more.
For further detail see my testimony before the House Subcommittees on Human Resources and Select Revenue Measures on June 27, 2012, “Marginal Tax Rates, Work, and the Nation’s Real Tax System.”
How Earnings Affect Benefits for Households with Children: The More Universal Case
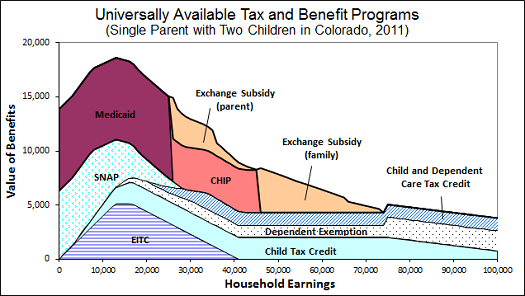
Posted: October 31, 2012 Filed under: Children, Income and Wealth, Shorts, Taxes and Budget 5 Comments »Many government programs automatically grant eligibility to all families with children, depending only on their income. As their incomes increase, however, these families often, but not always, receive fewer benefits. Some restrictions operate on a schedule: earn $1 more, get 30 cents less in benefits. Medicaid provides eligibility up to a given income level, then denies eligibility when one more dollar is earned (though usually with a delay). The dependent exemption only is available to those owing taxes, and only at high income levels is removed by the alternative minimum tax.
How do these programs interact?
The figure below considers a single parent household with children and shows how these various benefits vary as the earnings of the household increase. Because every household with children, including you and me if we are raising children, is eligible for these programs if our income falls in the right ranges, we can be said to belong to this benefit and benefit reduction system. For instance, as income increases from $10,000 to $40,000, our household would lose most earned income tax credits, SNAP (formerly known as food stamps), and much Medicaid, though under health reform other health subsidies would still be available. Note that in addition to these losses of benefits, direct tax rates from income and Social Security taxes would apply, though they are not shown here. For further detail see my testimony before the House Subcommittees on Human Resources and Select Revenue Measures on June 27, 2012, “Marginal Tax Rates, Work, and the Nation’s Real Tax System.” My next short describes the extreme welfare case.
Charities Making Payments in Lieu of Property Taxes
Posted: October 26, 2012 Filed under: Nonprofits and Philanthropy, Shorts, Taxes and Budget 11 Comments »Urban Institute recently held a conference on “State and Local Budget Pressures: The Charitable Property-Tax Exemption and PILOTs” which explored how increasing fiscal pressure on governments on the state and local level has led governments to re-examine which charities should be exempt from property taxes, and in some cases to ask for Payments in Lieu of Taxes (PILOTs), a voluntary payment of portion of their exempt property taxes from nonprofits.
The first panel “The Current Landscape” looked at costs and benefits of the current exemption; the second “Focus on Eds and Meds” took a closer look at the largest and most controversial beneficiaries of the exemption, nonprofit hospitals and colleges and universities; and the third “Negotiated Payments in Lieu of Taxes as Wave of the Future?” debated the use of Payments in Lieu of Taxes (PILOTs) and discussed how a well-designed PILOT program could be created.
The graph below, from a presentation by Daphne Kenyon of the Lincoln Institute of Land Policy, highlights the increasing prevalence of PILOTs as local governments seek new sources of revenue.
States with Jurisdictions Collecting PILOTs
Daphne Kenyon. 2012. “Payments in Lieu of Taxes: Balancing Municipal and Nonprofit Interests.” Urban Institute conference on “State and Local Budget Pressures: The Charitable Property-Tax Exemption and PILOTs,” on May 21, 2012 at the Urban Institute.
For more details I recommend reading the brief based off the conference, which describes the mechanics of governments asking for voluntary taxes from nonprofits in more detail, and gives an overview of the debate over such payments.
Charitable Contribution Deductions as a Percent of GDP
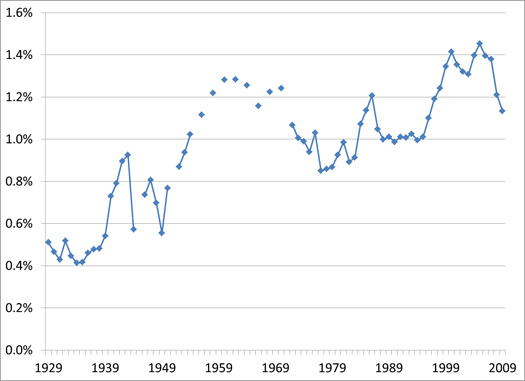
Posted: September 5, 2012 Filed under: Nonprofits and Philanthropy, Shorts 2 Comments »The chart below is part of the Tax Policy and Charities Project, an Urban Institute project analyzing the interactions of nonprofits and tax policy. This graph, drawn from Statistics of Income (SOI) data, shows the amount of charitable contributions that appear on individual tax returns from 1929 to 2009 as a percent of GDP. Note that this data is taken from US tax returns and thus only includes contributions reported by individual taxpayers who itemize and thus can claim the charitable deduction. Giving USA found that in 2009 total charitable giving was $280 billion; this includes giving by non-itemizers, corporations, foundations, and bequests. If only giving on itemized individual tax returns was included, this would have been only $164 billion or 59 percent.
Charitable contribution deductions rose in the post-World War II era with the increase in percent of the population paying taxes, bobbed around with the percent of taxpayers who itemized deductions over time, and, more recently, rose and fell with the stock market. Over the three years (2007-2009) noncash gifts of property particularly fell after a significant rise earlier in the decade.
For more graphs and tables on charitable giving, see the data section of the Tax Policy and Charities website.
Amount of Charitable Contributions Deducted on Itemized Tax Returns as a Percent of GDP
Source: IRS Statistics of Income Division, Table 2.1, 2011 and previous years; U.S. Department of Commerce: Bureau of Economic Analysis, National Income and Product Accounts Tables, Table 1.1.5, 2011.
Note: Because this data is taken from tax returns only charitable giving from itemizers is included. Percentages were found by dividing total amount of contributions in a given year by U.S. GDP in nominal dollars.
How to Increase Charitable Giving and Revenues at the Same Time
Posted: August 16, 2012 Filed under: Nonprofits and Philanthropy, Shorts, Taxes and Budget Leave a comment »Budget reformers often try to achieve deficit reduction by simply stacking up a bunch of expenditure cuts and revenue increases. Unfortunately, such an approach tends to avoid the systemic types of reforms that might make programs work better and save costs at the same time. Here’s one example from the charitable contribution deduction, taken from one of my testimonies.
The chart below shows several types of potential changes to charitable tax law—credits, caps on deductions, a floor under which deductions wouldn’t be allowed, and a floor combined with an additional incentive for non-itemizers who cannot currently use the deduction—such that each would increase government revenue by about $10 billion. Regardless of whether one believes that people have low or high response rates to the charitable incentive, it demonstrates that different proposals can have the same revenue effect but dramatically different effects on giving.
Source: Urban-Brookings Tax Policy Center Microsimulation Model (version 0411-2).
Note: The “low response” category uses a price elasticity of charitable giving of -0.5, and the “high response” category uses an elasticity of -1.0.
The last option—an “above-the-line” deduction with the 1.7% floor—ends up raising about $10 billion without reducing charitable giving at all. With a smaller floor, both charitable giving and revenues could be increased. At the other extreme, a refundable 15.25% credit raises $10 billion but ends up forcing an estimated loss of between $3 and $5.4 billion in charitable giving.
Note how combining options creates new possibilities. For instance, extending a deduction to non-itemizers by itself might be considered poor tax policy since it is believed to cost significant revenues per dollar of charitable pick-up. And it could add significantly to IRS compliance costs. But if combined with a floor on giving, the package could easily be designed to increase both revenue and charitable giving without adding to those IRS costs.
Should State Pension Plans Play Wall Street With Employees’ Money?
Posted: August 1, 2012 Filed under: Aging, Income and Wealth, Shorts, Taxes and Budget 2 Comments »In a recent examination of state pension plans, my colleagues and I discovered that states are increasingly tempted to solve their underfunded pension plan problems by acting a bit like Wall Street: hoping to make money out of the deposits they hold in a fiduciary capacity for their employees.
When a state plan has inadequate funding to pay promised benefits, someone eventually has to cover the difference. It could be taxpayers, those in the plan, or those who will be in the plan.
Because current and future taxpayers are already on the hook for a lot of past bills that have been left to them, states have tried to reduce their potential burden. Because existing state employees, especially those near retirement, have made plans for the benefits they have been promised, they have been asked to give up only a little. In many cases, their additional cost is confined to higher employee contributions for the remaining years of their careers only. Since the other two groups have been spared much of this burden, new employees have been asked to pay significantly more in both higher lifetime contributions and lower lifetime benefits than existing employees.
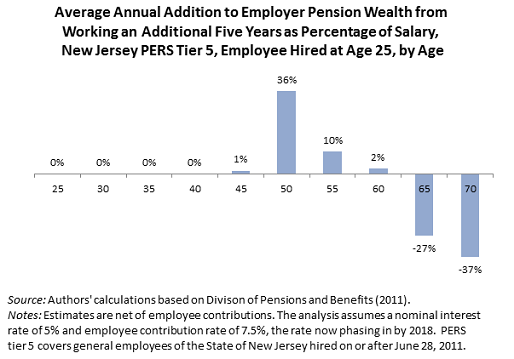
In our examination of one example, a reformed New Jersey plan, it turns out that many or most newly hired employees are unlikely to get lifetime benefits from the plan that are any higher than what they could earn with a modest interest rate—say, 2 or 3 percent—on their own contributions. Only those who work for the state for a very long time, such as 25-year-olds who stay between 30 and 40 years, get more.
The plan, however, assumes actuarially that the state will still earn a return of 8¼ percent on those employee contributions. In effect, the state hopes to make money out of their employee contributions just like a bank or Wall Street does: by leveraging up deposits, borrowing at one rate, and earning money at a higher rate.
A number of economists, actuaries, and accountants (see, for instance, Joshua Rauh and Robert Novy-Marx, Andrew Biggs, and, most recently, the Government Accounting Standards Board) have questioned the assumption of such a high rate of return.
We raise a further issue. Whatever the appropriate rate, how much should a state depend upon future employees to be net contributors to a pension plan, rather than net beneficiaries from it?
State Pension Reform: Is There a Better Way?
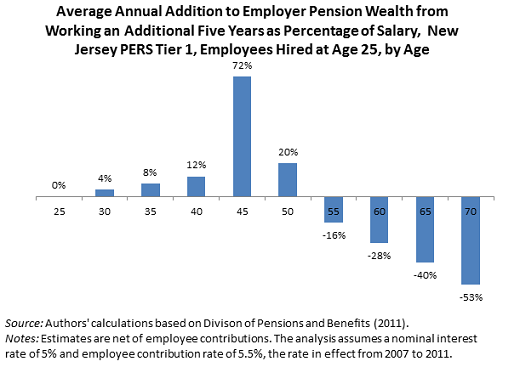
Posted: July 26, 2012 Filed under: Aging, Income and Wealth, Race, Ethnicity, and Gender, Shorts 1 Comment »Are the benefits of state pension plans allocated efficiently and fairly, and do they attract the best workers for the amount of money spent? Consider the graphs below for the state of New Jersey, which are somewhat typical of state pension plans in many other states. They show the annual pension wealth increments provided by the state for working for the state for five additional year for typical tier-1 (pre-reform) and tier 5 (post-reform) employees hired at age 25. Younger workers used to get very little, now they get nothing. Middle age workers get locked into the employment, regardless of how well it fits their skills or the needs of the state at that point. And older workers get very negative benefits, though at later ages than in the pre-reform era. For further details, see a paper (and two briefs) I published with Richard W. Johnson and Caleb Quakenbush, entitled “Are Pension Reforms Helping States Attract and Retain the Best Workers?”

