Is it Time to Make Kids a Higher Budget Priority?
Posted: September 18, 2014 Filed under: Children, Columns, Taxes and Budget Leave a comment »When it comes to how we spend our money, we seldom dwell on what we’re not buying. But money spent in one place cannot be spent in another. With the release of Kids’ Share 2014, the eighth in an annual series, my fellow Urban Institute researchers and I assess what share of the federal budget goes for kids and what shares go to other priorities. The word “share” is chosen deliberately: it forces us to recognize that a larger piece of the pie for someone must mean a smaller piece for someone else.
One major conclusion: despite several years of modest economic recovery and some budgetary successes for kids in previous decades, our elected officials—Democrats and Republicans, conservatives and liberals alike—have decided that kids must take it on the chin for the foreseeable future. Meanwhile, the rest of us will continue to gain, mainly when we hit older ages. Our retirement and health benefits will continue to grow, and we will continue to keep our taxes too low to pay for these benefits and the rest of government, no matter how well the economy is doing. Not that we or our elected officials would ever say this directly: you’ll be lucky to hear any discussion of these choices in any 2014 campaign.
No one votes formally to cut the kids’ share of the pie. They simply allow other shares to increase, driven by laws set in motion years and decades ago. Our priorities mainly revolve around ever more money for health, retirement, and tax subsidies, along with taxes so low that our children also get left with those bills and the higher interest costs that accompany them.
Let’s be clear: this scheduled hit on the kids’ budget does not derive from living in an age of austerity, an idea vying for first place on the list of really stupid interpretations of our current circumstances. We live in an age of extraordinary opportunity, not austerity. Despite the Great Recession, our total GDP per household (over $140,000) has never been higher. Ditto for measures of our national wealth, though those are perhaps inflated by current monetary policy. And there’s more to come. Within a little over a decade, despite lower economic growth, the budget offices project an increase in GDP per household of another $25,000 or so and increases in total government spending and tax subsidies of more than $10,000 per household.
And the kids? Well, they get close to none of it. Actually, less than none if you count out their very modest sharing in the large growth in health care spending.
It doesn’t have to be that way. For over twenty years, a consensus of sorts has developed that early educational and similar interventions, if done well, are a solid investment in our future. Yet progress here has been extremely slow. Child advocates are told that even $20 billion a year is out of reach in our “time of austerity.” But $20 billion is only about 1/40th of the expected growth in annual spending on Social Security, Medicare, and Medicaid (excluding the children’s share) by 2024. There’s also a growing consensus on creating a budget more oriented toward mobility and opportunity, but it’s still mainly rhetoric.
The simple question I’d like to ask is whether the numbers below, taken from Kids Share 2014, represent the direction that you want the government to take with the total increase in spending scheduled by 2024, a large share of which is made possible by economic growth. You can up that total or reduce it, depending upon your view of the optimal size of government. But either way, consider how you would assign the shares over the next 10 years or so. My guess is that almost none of you would allocate them this way.
Share of Projected Growth in Federal Outlays from 2013 to 2024 Going to Children and Other Major Budget Items (billions of 2013 dollars, except where noted)
|
Major budget items |
2013 | 2024 | Growth, 2013–2024 | Share of growth |
| Social Security, Medicare, and Medicaid | 1,472 | 2,259 | +787 | 58% |
| Interest on the debt | 221 | 714 | +493 | 36% |
| Children | 351 | 377 | +26 | 2% |
| Defense | 633 | 590 | -43 | -3% |
| All other outlays | 777 | 881 | +104 | 8% |
| Total federal outlays | 3,455 | 4,821 | +1,366 | 100% |
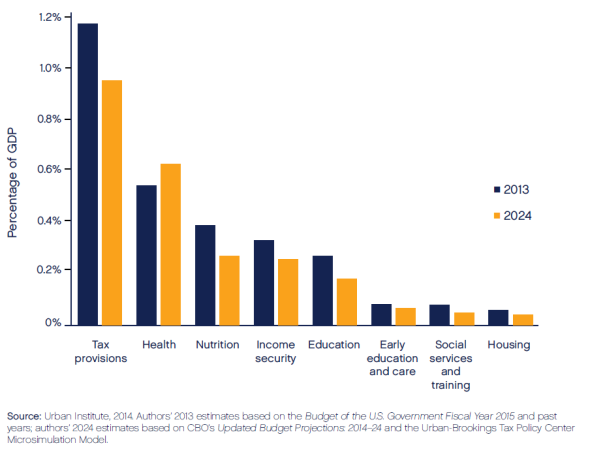
Federal Expenditures on Children as a Share of GDP, by Category, 2013 and 2024