Charitable Contribution Deductions as a Percent of GDP
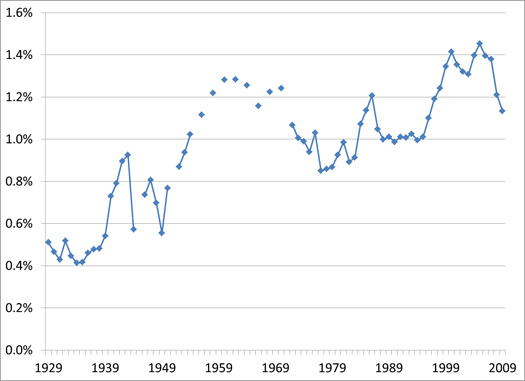
Posted: September 5, 2012 Filed under: Nonprofits and Philanthropy, Shorts 2 Comments »The chart below is part of the Tax Policy and Charities Project, an Urban Institute project analyzing the interactions of nonprofits and tax policy. This graph, drawn from Statistics of Income (SOI) data, shows the amount of charitable contributions that appear on individual tax returns from 1929 to 2009 as a percent of GDP. Note that this data is taken from US tax returns and thus only includes contributions reported by individual taxpayers who itemize and thus can claim the charitable deduction. Giving USA found that in 2009 total charitable giving was $280 billion; this includes giving by non-itemizers, corporations, foundations, and bequests. If only giving on itemized individual tax returns was included, this would have been only $164 billion or 59 percent.
Charitable contribution deductions rose in the post-World War II era with the increase in percent of the population paying taxes, bobbed around with the percent of taxpayers who itemized deductions over time, and, more recently, rose and fell with the stock market. Over the three years (2007-2009) noncash gifts of property particularly fell after a significant rise earlier in the decade.
For more graphs and tables on charitable giving, see the data section of the Tax Policy and Charities website.
Amount of Charitable Contributions Deducted on Itemized Tax Returns as a Percent of GDP
Source: IRS Statistics of Income Division, Table 2.1, 2011 and previous years; U.S. Department of Commerce: Bureau of Economic Analysis, National Income and Product Accounts Tables, Table 1.1.5, 2011.
Note: Because this data is taken from tax returns only charitable giving from itemizers is included. Percentages were found by dividing total amount of contributions in a given year by U.S. GDP in nominal dollars.


[…] –Charitable Contributions: Gene Steuerle charts charitable giving as a percentage of GDP. “The chart below is part of the Tax Policy and Charities Project, an Urban Institute project analyzing the interactions of nonprofits and tax policy. This graph, drawn from Statistics of Income (SOI) data, shows the amount of charitable contributions that appear on individual tax returns from 1929 to 2009 as a percent of GDP. Note that this data is taken from US tax returns and thus only includes contributions reported by individual taxpayers who itemize and thus can claim the charitable deduction. Giving USA found that in 2009 total charitable giving was $280 billion; this includes giving by non-itemizers, corporations, foundations, and bequests. If only giving on itemized individual tax returns was included, this would have been only $164 billion or 59 percent.” […]
saturnin : le roi des bougres, c’est Sa Majesté Siméon.lamidourges : le &ln&qo;unbsp;petit&absp;» est vraiment inutile, car « roi de Bourges » implique la petitesse (du royaume), inutile comme les majuscules dont vous parlez par ailleurs.Polyamid : comment faut-il comprendre votre allusion à Lagardère ?