Reducing Wealth Inequality Requires Holding Risky Assets
Posted: September 29, 2016 Filed under: Economic Growth and Productivity, Income and Wealth 5 Comments »
How do people build wealth? How do low-wealth families climb the economic ladder? It’s simple. They save. They get decent or even above-average returns on their savings. And they reinvest those returns over time. Unless policymakers and advocates face up to these simple propositions, policy efforts to reduce wealth inequality will go for naught.
Over many years I have had the privilege of working with groups concerned with wealth inequality and promoting asset growth. One of them, the Corporation for Enterprise Development, has been holding its biennial Assets Learning Conference, engaging over one thousand professionals. I cofounded and work with the Urban Institute’s Opportunity and Ownership initiative, which researches wealth inequality. Because of their concern for the well-being of low-income, low-wealth households, these engaged individuals often try to figure out ways that government can simultaneously support and protect more vulnerable populations. One consequence, though, is a hope and sometimes belief that asset-building policies can increase wealth without reducing consumption and can generate higher returns without requiring risk taking.
But saving by definition means forgoing consumption. Even if government provides the money, it forces individuals to save rather than immediately spend that money.
This fact creates a controversy among progressive advocates. A dollar spent on wealth building means a dollar not spent on food, health care, or other transfers for immediate needs.
Finance 101 further teaches that higher returns on saving come from investment in riskier assets. The expected return on stock is higher than the return on bonds, and the expected return on bonds is higher than the return on savings accounts and Treasury bills. Over several decades the after-inflation investment return on corporate stock has averaged close to 6 percent, whereas the return on five-year government bonds sits at around 2 percent. The expected return on many saving and checking accounts is close to zero. Compounded over time, average stock market investors will see their money multiply about eight times after 36 years; average medium-term bond investors will see theirs double. Savers using only checking and saving accounts, meanwhile, will see little if any growth.
Over short periods, however, stocks have the highest risk of the assets just mentioned, while savings accounts have the least. Over very long periods, the risks reverse. Investing in the stock market is like flipping a coin bent enough that betting on heads on average nets a good return, but there’s a high probability of a loss with a few flips. As the number of flips increase, the odds of having more heads than tails get better and better. John Bogle, founder of Vanguard, said it like this: “The data make clear that, if risk is the chance of failing to earn a real return over the long term, bonds have carried a higher risk than stock.”
It’s possible to buy stock and insure against losses relative to, say, a short-term bond. But the insurance will cost the difference in returns plus additional transactions costs. Thus, attempts to provide low- and moderate-wealth households both higher returns and low risk tend to fail.
Just look at the household assets reported on wealth surveys. Wealthy households hold the vast majority of their wealth in stock and small business assets and real estate either directly or through retirement accounts. They make much of their money not just by saving more initially, but by allowing the saving on higher-return assets to compound. Low-wealth households, meanwhile, own few or no high-return assets, tend to hold more debt relative to their incomes, and often pay higher interest on that debt.
Timing matters, too, especially when it comes to large, infrequent purchases like buying a home. Mortgages became widely available to lower-income households in the early 2000s, when home prices were at a peak, but less available after the Great Recession, when prices were lower and owners were getting capital gains in many regions. As Bob Lerman, Sisi Zhang, and I have pointed out, this created a “buy-high, sell-low” mortgage policy that devastates low-wealth households, including the young.
The policy implications are clear. Simply taxing the rich more or distributing more to low-wealth households will do little to narrow wealth inequality. Transfer programs rarely encourage wealth-holding and may even exacerbate private wealth inequality by imposing asset tests and by favoring renting over homeownership.
None of this means that the rich shouldn’t pay higher taxes or that transfer programs don’t protect vulnerable families or even provide a type of “asset” in the form of income and risk protection. That’s another subject. The subject here is the distribution of private wealth and the power it brings.
Advocates and lawmakers trying to counter wealth inequality, therefore, must find ways to get low-wealth savers into longer-term assets like stock and real estate, mainly through retirement plans and homeownership. Small business ownership also matters. And, subsidies provided by government must encourage long holding periods—that is, saving over time, not short-term deposits. Deposits followed quickly by withdrawals or loans don’t increase saving. Nor do proposals that subsidize borrowing encourage homeownership, since, by encouraging more borrowing, they often reduce net home equity.
Of course, many low-wealth households are not ideal investors in riskier assets. But there are risks and there are risks. Remember that Social Security and Medicare—and, to some extent, traditional pension plans—already require nonelderly adults, whatever their other needs, to “save” some income today to prevent inadequate income in old age.
Successful investment requires forgoing consumption, taking risks, and adopting a long-term view. Those attempting to address wealth inequality must either recognize these fundamental facts—and the related costs involved—or fail in their mission.
Photo by 401(K) 2012 via Flickr Creative Commons.
Restoring More Discretion to the Federal Budget
Posted: September 15, 2016 Filed under: Aging, Economic Growth and Productivity, Taxes and Budget 1 Comment »By: C. Eugene Steuerle and Rudolph G. Penner

The nation must change how it makes budget decisions. Permanent entitlement and tax subsidy programs, particularly those that grow automatically, dominate federal spending. Their growth, often set in motion by lawmakers long since dead or retired, is not scrutinized with the same attention as the discretionary programs Congress must vote on each year to be maintained, as well as grow. The result? A predetermined, inflexible federal budget that does not reflect our country’s needs.
Social Security, Medicare, and Medicaid, the three largest entitlement programs, accounted for $1.9 trillion, or about half, of federal spending in 2015. More important, they will absorb more than all the increase in tax revenues our growing economy will provide over the next decade and beyond. This astounding growth, combined with political unwillingness to collect enough taxes to pay for current government spending, translates to accelerating increases in budget deficits and national debt.
Congress can take steps to draw more attention to long-term sustainability when making budget choices. One possible reason such growth remains unchecked is that much of the budget process currently focuses at most on total spending and revenues over the next 10 years. This leads to game-playing when policymakers decide to increase government largess: Costs can be hidden outside the budget window, or costly “pay-fors” can be postponed for a later Congress to deal with.
Reforms focused on a 10-year window are similarly myopic and inadequate. To protect existing beneficiaries when enacting reform, typically only a small portion of the deficit reduction shows up in the first decade; the most impact is made on future beneficiaries, not current ones. A longer time horizon also makes reforms more palatable politically; it shifts the focus from threatening today’s retirees to allowing younger households to garner greater resources during their working years in exchange for less relative growth in government retirement benefits.
Better presentations of the budget priorities set by the president and Congress is crucial for reform. Current budget documents do not give a very clear picture of how much growth in spending is predetermined versus newly legislated. Nor do they reflect the relationship among real growth in taxes, tax subsidies, and spending programs.
What would such an improved portrayal show? Near-term problems in how our money is spent, not just long-term ones related to growing debt. Today’s current law, as estimated by the Congressional Budget Office, implies $1.281 trillion more inflation-adjusted dollars will be spent in 2026 than in 2016: $845 billion from revenue increases and $436 billion from deficit increases. Of these dollars, 33 percent will be devoted to Social Security and 37 percent to health programs, mostly Medicare and Medicaid. A further 27 percent will be devoted to larger interest costs related to debt increases.
What does this leave for everything else? Essentially nothing. About 1 percent of the $1.281 trillion would be spent for defense and 4 percent for other mandatory spending, most of which is for non-health entitlements. Domestic programs that must be funded every year will be cut slightly in real dollars while declining substantially as a share of national income. Only much larger deficits at an unsustainable level prevent further hits on these programs.
Entitlements should be reviewed more frequently, and periodic votes of Congress should determine most of their growth. Permanent tax subsidies need similar scrutiny and limits placed on their automatic growth. In good times, tax rates must be high enough to avoid pushing today’s costs onto tomorrow.
Automatic triggers that activate if economic and demographic developments turn out worse than expected are one way to slow benefit growth or increase revenues. Sweden, Canada, Japan, and Germany use triggers in their Social Security programs; U.S. policymakers can learn from them. Of course, triggers work best when they reinforce sustainable programs. If required adjustments are too politically painful, Congress will simply override them, as it did for many years with updates to physician payment rates in Medicare.
We must grant future voters and those they elect more flexibility to allocate budget resources. Improving the way Congress budgets can enable government to better respond to changing needs, set new national priorities, and get off a disastrous fiscal path.
— C. Eugene Steuerle is an Institute fellow and the Richard B. Fisher chair at the Urban Institute. Rudolph G. Penner is an Institute fellow at the Urban Institute. They are the coauthors of “Options to Restore More Discretion to the Federal Budget,” a joint publication by the Mercatus Center at George Mason University and the Urban Institute.
A version of this post originally appeared on Economics21.
Photo by 401(K) 2012 via Flickr Creative Commons.
The ‘Save Our Social Security Act of 2016’: A Major Step Toward Reform
Posted: July 29, 2016 Filed under: Aging, Columns 7 Comments »Without fanfare, a bipartisan group of Representatives has introduced a bill that could bring Social Security’s finances close to long-term balance. Labeled the “Save Our Social Security Act of 2016,” the proposal also recognizes an important fact: that the longer we delay reform, the more it will cost post-babyboom generations.
Gen X and Y and Millennials are already scheduled to pay more for their benefits than boomers and older generations no matter what path we take to reform. Whether we raise payroll taxes, use more income taxes to pay off Social Security obligations, or cut benefits, someone must pay. Delaying reform only increases the burden on the young.
The “SOS Act,” as it is called, was introduced by five Republicans and one Democratic member of the House. Co-sponsors Reid Ribble (R–WI) and Dan Benishek (R–MI) were joined by Jim Cooper (D–TN), Cynthia Lummis (R–WY), Scott Rigell (R–VA), and Todd Rokita (R–IN). They pieced together the proposal using an interactive tool offered by the Committee for a Responsible Federal Budget. (Disclosure: I serve on the committee’s board of directors).
The bill contains these primary features (listed in order of their ability to shrink Social Security deficits; the last two would raise deficits):
- Increase the “normal retirement age” (NRA) by two months per year until it reaches 69 for those turning 62 in 2034. Thereafter, it indexes the NRA to increases in longevity, so that the fraction of a lifetime spent in retirement stops growing.
- Levy the OASDI tax on 90% of covered earnings.
- Use a more accurate measure of inflation to determine Social Security’s cost-of-living adjustment (COLA), so that benefits fall by about one-third of one percent per year.
- When calculating average Social Security earnings, count a few more years than the 35 top-earning years, thereby creating a more accurate (and usually lower) measure of the share of a worker’s average lifetime earnings that will be replaced under the Social Security benefit formula.
- Under Social Security’s current design, the first dollars of average lifetime earnings are replaced at a 90% rate, the next dollars at a 32% rate, and the last dollars at a 15% rate; under the new proposal, the 15% rate would drop to 5% for those in that top earnings bracket.
- Raise annual benefits by roughly $1,000 a year for those with more than 20 years of coverage, and let that amount grow at the average wage growth rate.
- Set a special minimum benefit so that, for instance, workers with 20 years of coverage would receive a benefit no lower than the poverty level, and increase the minimum benefit by the average wage growth rate instead of the inflation rate.
These changes would bring the Social Security system close to long-term solvency. Enough taxes would accrue to pay full benefits not only for 75 years, but also to roughly cover benefits in the 75th and later years. By contrast, the last major reform (in 1983) didn’t close the long-term gap.
Almost as soon as that Reagan-era bill was passed and signed, its failure to cover the period after 75 years led Social Security actuaries to declare the system’s finances out of balance. The solvency issue would pop up again under subsequent presidents. The SOS Act, however, would restore balance, and do so equitably: by closing one-third of the funding gap through tax increases, one-third through progressive rate changes, and one-third through adjustments in the retirement age.
The bill can still be improved. It could do more, at a fairly moderate cost, to help those with below-median lifetime incomes. (As a member of the bipartisan 1999 National Commission on Retirement Policy, I was among the first to propose higher minimum benefits as a way to address distributional issues and improve benefits for low and moderate-income elderly.) The bill could also address the structure of survivor and spousal benefits, which is built on the notion of a stereotypical mid-20th century household with a male breadwinner and a stay-at-home wife. It could also address the negative economic consequences of keeping the early retirement age at 62 no matter how long people live.
For those who are interested, Social Security’s assessment of the bill’s consequences is helpful to read but it can also be misleading. The assessment implies that future retirees’ income replacement rates will fall relative to those of current retirees. That’s true only if Americans keep retiring as early as they currently do. In fact, many people (except those with the highest incomes) could enjoy an increase in replacement rates simply by working an additional year for every year the average life expectancy improves.
A version of this post originally appeared on the Retirement Income Journal.
The Federal Government on Autopilot: Mandatory Spending and the Entitlement Crisis
Posted: July 8, 2016 Filed under: Economic Growth and Productivity 1 Comment »Yesterday, I testified before a House Judiciary Committee Task Force on the risks of having so much of government on auto-pilot. Through permanent, automatic, and growing mandatory programs and tax subsidies, past lawmakers have pre-committed the majority of new revenues that the government is scheduled to collect. As a result, today’s lawmakers have little ability to revise priorities to keep up with a rapidly changing world. Here is a lightly edited version of my oral testimony. My full written testimony is here.
Let me begin by noting that we live at a time of extraordinary possibility, but you wouldn’t believe it by looking at the headlines. We have never before been so rich, even if many needs remain unaddressed, and many do not share in that growth.
Yet, partly because we are ruled over by dead men (and, yes, they were largely men), we stand with our backs to an ocean of possibilities that lay at our feet. I try to show this by two means. First, a decline in what I call fiscal democracy—the discretion left to current voters and policymakers to determine how government should evolve. This index measures how much of our current revenues are pre-committed to programs that require no vote by Congress or, in technical terms, to mandatory spending programs. This index is politically neutral: fiscal democracy is reduced through both increases in mandatory spending and reductions in taxes.
By this measure, in 2009 for the first time in US history, every dollar of revenue was pre-committed before the new Congress walked through the doors of the Capitol.
Steuerle-Roeper Index of Fiscal Democracy
Percentage of federal receipts remaining after mandatory and interest spending
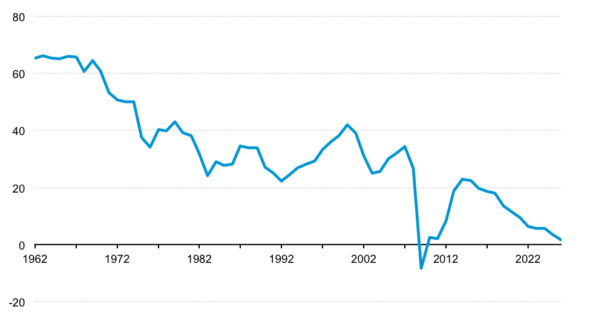
Source: C. Eugene Steuerle and Caleb Quakenbush, 2016 calculations based on data from OMB FY2017 Historical Tables and CBO Updated Budget Projections: 2016 to 2026.
Notes: Projections assume current law.
The second piece of evidence comes from simply comparing two budgets: first, a traditional budget such as prevailed over most of this nation’s history, where spending is largely discretionary, and, second, a modern budget, where growth in spending and tax subsidies are committed to rise automatically faster than revenues. Congress and the president end up in a never-ending game of Whack-A-Mole or, should I say, Whack-Some-Dough. No wonder there are still budget problems after deficit-reducing actions in 1982, 1983, 1984, 1987, 1990, 1993, 1997, 2005, 2011, 2013, and 2015, among others.
[The Need for Discretion]
Consider the consequences. It’s not just the economic problems of rising debt and inability to respond adequately to the next recession or emergency. It’s also the political requirement imposed on you as legislators to renege on promises to the public and then facing its wrath in elections.
Yet, through inability to work together, both parties lose their agendas, getting government that is both fat and ineffective at meeting public needs.
For example, out of a scheduled increase of close to $12,000 annually per household scheduled in additional spending and tax subsidies by 2026, almost nothing goes for programs for all that encourage the development of earnings, wealth, human and social capital. And kids also get essentially nothing—NOTHING!
Restoring fiscal democracy requires nothing more or less than restoring greater discretion to the budget. Democrats must be willing to limit the share of spending on automatic pilot, and Republicans must do likewise for tax subsidies, while agreeing to collect enough revenues to pay our bills. And both the president and the Congress need to be held responsible for ALL changes in the budget, whether newly enacted or passively allowed to continue.
Restoring discretion does not simply mean paring program growth or raising taxes, but opening the door to modernizing programs to better meet public needs, including providing greater opportunity for all.
I am not naïve about the difficulty of reversing a multi-decade decline in fiscal democracy. Yet until we restore greater discretion to the budget, the frustration and anger faced by political parties and the public here and around the developed world will continue, deriving in no small part from a budget process that has shifted national debates from what we can do to what we can’t—that is, from letting dead men rule.
A version of this post originally appeared on TaxVox.
Health costs, not Obamacare, dominate the future of federal spending
Posted: July 1, 2016 Filed under: Health and Health Policy 1 Comment »A version of this post originally appeared on Health Affairs.
From all the political discussion about health care, you’d think that government health policy lives or dies by what happens to the Affordable Care Act, or Obamacare. One side offers almost nothing apart from saying Obamacare must (somehow) be abandoned. The other side tells us that health costs, partly thanks to Obamacare, might be under control. Neither side faces up to the continuing dominance of health costs in projections of future federal spending.
Meanwhile, a recent study suggests yet again that spending much more on health care may do little to improve mortality and opportunity for the disadvantaged.
Like most debates that become political, the discussion tends to be numberless. Numbers aren’t always popular for those whose facts must fit their storylines, as opposed to those whose storylines evolve from the facts.
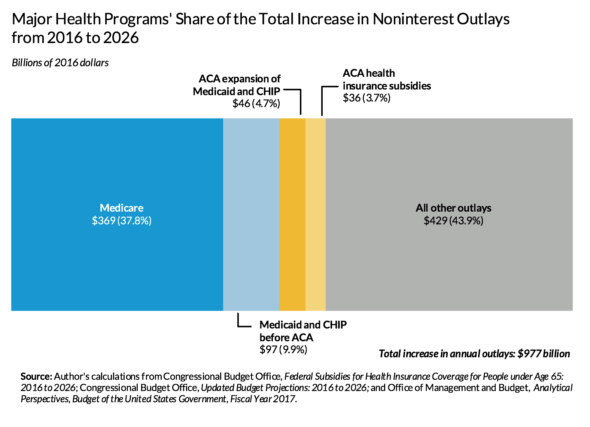
So what do the numbers tell us? Figure 1 shows that health care spending composes most of all projected increases in noninterest outlays of the federal government, but that Obamacare for those under age 65 is only a moderate cause of this growth.
Note: Because I focus on health costs, not on how we pay for them, calculations exclude payments made by taxpayers to support these programs, such as Medicare Part B premiums that budget analysts sometimes net from gross outlay payments. Allocation of costs or changes in costs over time because of Obamacare may exclude potential secondary impacts, such as a shift out of employer-provided health care or a change in Medicaid costs for people over age 64.
The health spending problem is still with us
Despite slower health spending growth, we have not solved our health spending problem. In 2026, the federal government is expected to spend (and subsidize through the employer coverage tax exclusion) at least $693 billion (in 2016 dollars) more than today for major health insurance programs. If we exclude the tax subsidies (as the exhibit does), this sum decreases, but only to $548 billion.
Excluding interest on debt, federal outlays for major health programs (excluding tax subsidies, which aren’t counted in outlays) eat up around 29 percent of today’s total federal outlays but about twice as much—56 percent—of the growth in total outlays between now and 2026 (figure 1).
Turning to the economy more broadly, for every additional dollar of real gross domestic product per capita expected 10 years from now, 20 cents will go toward supporting the rise in federal health insurance programs costs. And even these numbers significantly understate growth in total health costs by leaving out state and local health costs, other federal costs such as health research, and private spending on health care. Adding these other costs would indicate that health care continues to eat up a very large fraction of economic growth. Much of the confusion here about whether “health cost growth has slowed” occurs because lower economic growth tends to reduce the growth rate of all spending items, including health care, but not necessarily the share of growth absorbed by health care.
The relatively minor role of Obamacare
Obamacare has very little to do with any of this. If we include growth in tax subsidies for health insurance, Obamacare programs for those younger than 65, including Medicaid expansion and new health insurance subsidies in the Marketplace, entail only about 8 percent of the federal government’s cost for major health programs and 12 percent of the projected increase in annual cost within a decade. And even those additional Obamacare costs are offset partly by cuts established in the Affordable Care Act.
In contrast, growth in Medicare makes up half or more of all federal major health program spending and of the projected increases; the tax break for employer-provided insurance and the Medicaid program for those eligible before Obamacare also entail significantly higher costs than does Obamacare.
Moving forward
We have a long way to go in reforming health care and health care costs. Such reform must tackle all elements of what I have labeled our four-tranche system of federal subsidies: Medicare, Medicaid, employment-based subsidies, and the exchange subsidies established in Obamacare. We must also remember that the goal of reform is not simply to reduce costs but to shift resources to where public gains are expected to be higher, including preventing health problems before they arise.
Copyright ©2015 Health Affairs by Project HOPE – The People-to-People Health Foundation, Inc.
A Universal Basic Income? Right Debate, Wrong Answer
Posted: June 22, 2016 Filed under: Income and Wealth 1 Comment »Recently, advocates have revived and extended an old idea: that government should give everyone, regardless of their economic circumstances, a universal basic income (UBI). For instance, each single person would get a government cash payment of, say, $12,000, which is just above the official poverty level of $11,700. The benefit would reduce, or perhaps replace, current government tax and benefit programs aimed at low-income households.
The proposal raises some important questions about how government should help people avoid poverty and more generally support almost all of us who get government benefits of one type or another. While some critics wonder whether such an ambitious idea is affordable, I’m more concerned about whether society would be better off if government used the money to create opportunity for those who are struggling financially.
Progressive supporters of UBI see it as a way to eliminate poverty by redistributing more money from the rich. Those on the right say it could replace costly and administratively inefficient welfare-type programs. Adherents include Andy Stern, former head of the Service Employees International Union, and a growing group of Silicon Valley executives, such as Sam Altman, president of Y Combinator, a venture-capital firm which is funding a pilot program to research UBI in Oakland, CA.
The goals of reducing both poverty and inefficiency are worthy. But we want to be sure we don’t discourage work in an economy already facing unprecedentedly low levels of labor force growth. And while combining and simplifying programs makes sense, it can’t be done in one easy step.
Think about how complex low-income support programs have become since Milton Friedman and my mentor Robert Lampman of the University of Wisconsin first proposed in the 1960s a related idea, a negative income tax (NIT). A half-century ago, there was no federal earned income tax credit (EITC), supplemental security income (SSI), child credit, Head Start, special education, or Section 8 low income housing assistance. Congress was just enacting Medicaid, and national health care spending was less than a third of what it is today as a share of the economy. Supporters of UBI are not clear about what they’d do with these programs, or how they’d address pressures such as medical cost growth. Nor do they say how they’d deal with existing tax subsidies, such as the EITC, and the ways people are taxed indirectly as their eligibility for these benefits is phased out. By choosing the acronym NIT, Friedman and Lampman recognized that phasing out benefits as income rises is effectively a tax rate increase.
If they don’t replace current support programs, in whole or in part, supporters of UBI need to figure out how to pay for the new cash benefit. And critics, such as Bob Greenstein and Eduardo Porter, question whether we could afford such a program.
But in the medium term, a UBI could be funded simply by freezing the cost of current benefit programs and shifting scheduled increases to a cash program. Consider: Today, government at all levels provides about $35,000 annually in direct supports, including tax subsidies, per household. But that amount is due to increase by $10,000 to $15,000 by about 2026 and double within a few decades.
I’d prefer to shift larger shares of our direct support budget into promoting opportunity for work and saving, while promoting human and social capital. Such efforts would emphasize long-term earnings growth, wealth accumulation and upward mobility, whereas the UBI, with its focus on current consumption, would likely increase the inequality of market incomes by discouraging work.
Not that UBI supporters are wrong in stressing the inefficiency of existing programs. The type of efficiency they seek could be pursued in part by bundling programs together in a voucher that could be spent, say, on food, housing, or education—a design my Urban Institute colleague Bob Lerman and I called structured choice.
Despite the flaws of UBI, give its supporters some credit. They recognize both that the existing direct support system is quite flawed and we that do not have to be bound forever to a structure cobbled together over past decades in ways inattentive to current and future needs. There are just better reforms available than the UBI.
This post originally appeared on TaxVox.
Thanks, Boston, for Restoring My Faith
Posted: June 1, 2016 Filed under: Columns 2 Comments »Like many others, I have found it difficult to maintain a sense of optimism this campaign season. I’m less anxious about the candidates, whatever their limitations, than about how much we, the public, seem to tolerate—even at times support—campaigns whose modus operandi focuses on attacking others, whether other candidates, parties, or populations other than our own. I always worry when any of us (including myself) seeks an enemy on which to re-anchor a threatened political or religious belief or simply project discontent. At a minimum, this way of tackling our problems retards progress by failing to focus on what we can do together. More dangerously, it portends either disintegration or authoritarianism when it arises in decent times or periods of limited growth, thereby gaining potential to explode in times of true distress. If you want evidence, just look at the retreat from democracy in some developed nations throughout the 20th century or today in Turkey, Hungary, and, potentially, Austria and parts of Western Europe.
A day at the Boston marathon more than took away my gloom. I went there to cheer on my stepdaughter and a friend with whom I have worked at an Alexandria community foundation. It wasn’t just their fortitude and courage, as well as the efforts of thousands of other runners, that inspired me. My faith in humanity was restored by the extraordinary support of the public. There they were by the hundreds of thousands, from one end of the course to the other, cheering on everyone who passed by.
There were no class divisions for whom the bystanders cheered; everyone was a hero for trying. The runners ranged from the world’s best to those who barely had the stamina and body parts to survive—or maybe that’s my own projection of what I would look like out there. When the mobility impaired ran by, the cheers got even louder. No one was a stranger. Each public cheerleader only competed to see who could be loudest and support the most runners. Local bands found a street corner on which to play. Businesses gave out ice cream and other free goodies. Conversations flourished among absolute strangers. One of my companions broke into tears witnessing the community response.
Survivors of the 2013 terrorist attack also ran, making clear that fear—the only thing that can make terrorism succeed—would not deter them. Ken Ballen, the brilliant president of Terror Free Tomorrow, has long stressed that terrorists need a community to thrive or even survive. Such communities can form around, or in response to, blaming or distrusting others; they disconnect from the people and communities around them that don’t share their views. They are the exact opposite of what I observed of Boston that day. Thus, despite the very real pain in Boston, as well as San Bernardino, Fort Hood, Charleston, and other parts of the country attacked by individual terrorists or fanatics, our nation still thrives because of the strength and resilience of our communities.
So thank you, Boston. Your actions do more than inspire me. They drive me to undertake actions that include, unite, and ultimately strengthen the communities in which I work, play, and live. Whatever happens in the remaining campaign season, I can only pray that our leaders, whether newly elected or reelected, will learn from and follow your lead.
What the Success of Trump and Clinton Portends for Future Elections
Posted: May 24, 2016 Filed under: Columns Leave a comment »Despite their divergent policy views, Hillary Clinton and Donald Trump have many similarities that help explain their success in this election season. Pay attention: these lessons will be taken up, for better or worse, by future candidates seeking office in an unreformed system and by those in Congress, the states, or the political parties seeking reform after viewing with disdain the 2016 primary election process. With one exception, I list these common attributes in what I consider their rough order of importance to this and future campaigns: initial fame, use of identity politics through appeal to an excluded group, wealth, Ivy League pedigree, New York connections, presidential campaign experience, a sense of entitlement, and birth year.
- Fame. From the beginning, Donald Trump and Hillary Clinton were the most famous candidates in their respective parties, even before the media facilitated Trump’s further rise by granting him an extraordinary share of the attention. Correspondingly, the weakest candidates also tended to be the least famous. Initial fame has usually been quite important to both parties, though a bit less so on the Democratic side, where the Jimmy Carters and Barack Obamas have been able to build upon their appeals as outsiders. More unusually this time around, it didn’t seem to matter much where the fame came from, thus following the saw of our increasingly media-crazed world that bad publicity is better than none at all.
- Identity politics and appeal to an excluded group. Clinton and Trump—along with Cruz and Sanders—built their campaigns on a base of vocal supporters who felt underrepresented and denied a fair voice in government: liberal older women, men without college degrees or with declining job prospects, evangelicals, and the young. Yes, each of these groups is diverse, but each provided a surge in voters for the primaries as well as enthusiastic volunteers for the campaign trudge. The same might be said eight years ago about President Obama’s appeal to liberals of all colors who felt that his election would help complete a civil rights revolution. This pattern amends the traditional notion that the excluded group to whom one must appeal is the far left or far right of each party, or as Richard Nixon told Bob Dole, “You have to run as far as you can to the right because that’s where 40 percent of the people who decide the nomination are. And to get elected you have to run as fast as you can back to the middle.” With declining party identity, by the time of the general election the majority of the public now identifies with neither party nor that excluded group successful in the primaries. Themselves now largely excluded unless new coalitions can be formed, they will decide the final election by whom they vote against rather than for.
- Wealth. The Clintons are worth at least $50 million and perhaps more than $100 million. While Trump has been accused of exaggerating his net worth, it is plentiful enough. Or, as he told Good Morning America in 2011: “That’s one of the nice things. I mean, part of the beauty of me is that I’m very rich. So if I need $600 million, I can put $600 million myself. That’s a huge advantage. I must tell you, that’s a huge advantage over the other candidates.”
- Ivy League credentials. Hillary Clinton has degrees from Wellesley (one of the “little Ivys”) and Yale. Trump got his bachelor’s degree from the University of Pennsylvania. Cruz was educated at Princeton and Harvard, and Sanders received his degree from the University of Chicago. This trend isn’t new: Obama graduated from Columbia and Harvard, George W. Bush from Yale and Harvard, Bill Clinton from Oxford and Yale, and George H.W. Bush from Yale. All recent Supreme Court justices are Yale or Harvard Law School graduates. Don’t be fooled by stories about the declining power of old boy and old girl networks, or by tales that a strong education advances worldly fame or success, at least at the top of the pyramid, more than where you go to college, graduate school, or law school.
- New York connections. More money and more connections. Trump, a New York real estate magnate, and Clinton, a senator from New York, have been able to build upon their geographical connections to finance and wealth. All Republican presidents from Hoover onward, apart from war hero Eisenhower, have been from the big, moneyed states of California, New York, or Texas. Add Massachusetts to the list, and both parties have usually had a major candidate, if not actual nominee, from one of those four states for the past 80-some years. (Cruz, of course, is from Texas.) Bigger states also add to fame and electoral votes, not just money and connections.
- Presidential campaign experience. Everyone remembers that Clinton ran before, but you might not remember that Trump floated the idea of running in 1988, 2004, and 2012; in 2000, he won two primaries under Ross Perot’s Reform Party banner. Of course, here we have nothing new. Many presidents—including Kennedy, Johnson, Nixon, and both Bushes—previously ran for president or vice president or knew what to do from participating in their fathers’ efforts.
- A sense of destiny. Both major party candidates feel like they have worked hard and paid their dues, that others are conspiring to deny them something they have earned, and that they personally must acquire power to fight for our rights. Perhaps this is a requirement for anyone running for president.
- Birth year 1946-47. Malcolm Gladwell has commented on the power of small cohorts, ranging from late 19th-century industrial monopolists to leaders of the IT revolution, to dominate many thrusts forward. Consider, then, some birth years: Bill Clinton, George W. Bush, and Donald Trump, 1946; Hillary Clinton, 1947. Maybe this is the JFK factor: the excitement of the Kennedy-Nixon election and the resulting attraction to politics of those in late adolescence in 1960. But whether a random event or not, soon we will likely have 20 to 24 years of the presidency held by people born within either a 2- or 14-month period. Perhaps less repeatable than other attributes noted above. Or is it? Twenty-one senators were born between 1944 and 1950.