Tax Reform and Charitable Contributions
Posted: February 14, 2013 Filed under: Nonprofits and Philanthropy, Shorts, Taxes and Budget 1 Comment »The debate over the charitable deduction mistakenly pits those who acknowledge that the government needs to get its budget in order against those who recognize the extraordinary value of the charitable sector. The tax subsidy for charitable contributions should be treated like any other government program, examined regularly, and reformed to make it more effective. In fact, the charitable deduction can be designed to strengthen the charitable sector and increase charitable giving while costing the government the same or even less than it does now.
What’s the trick? Take the revenues spent with little or no effect on charitable giving, and reallocate some or all of them toward measures that would more effectively encourage giving.
For example, to increase giving Congress can do any or all of the following:
- allow deductions to be given until April 15 or the filing of a tax return;
- adopt the same deduction for non-itemizers and itemizers alike;
- consider proposals to ease limits on charitable contributions, such as allowing contributions to be made from individual retirement accounts (IRAs) and allowing lottery winnings to be given to charity without tax penalties;
- raise and simplify the various limits on charitable contributions that can be made as a percentage of income;
- reduce and dramatically simplify the excise tax on foundations; and
- change the foundation payout rule so it does not encourage pro-cyclical giving.
Congress can more than pay for these changes with little or no reduction in revenue if it would:
- place a floor under charitable contributions so only amounts above the floor are deductible (economists generally believe that some base amount of contributions would be given regardless of any incentive, thus floors have less effect on giving);
- provide an improved reporting system to taxpayers for charitable contributions;
- limit deductibility for in-kind gifts where compliance is a problem or the net amount to the charity is so low that the revenue cost to government is greater than the value of the gift made; and
- to help the public monitor the charitable sector, require electronic filing by most or all charities.
Budget and tax reform are now unavoidably intertwined. When it comes to the tax law concerning charitable contributions, we can do a lot to make our subsidy system more effective from both a fiscal and a charitable sector standpoint.
For more details, see my congressional testimony for today’s hearing on “Tax Reform and Charitable Contributions” before the Committee on Ways and Means.
Fiscal Policy After ATRA
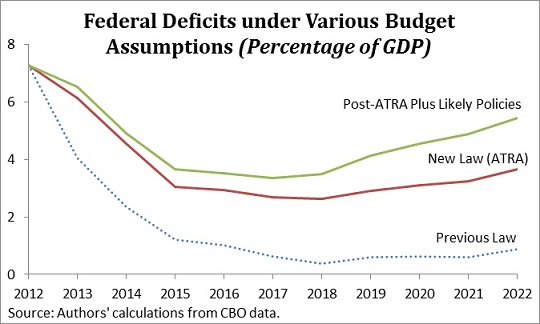
Posted: February 1, 2013 Filed under: Shorts, Taxes and Budget 5 Comments »The fiscal cliff–averting American Taxpayer Relief Act (ATRA) significantly changed the policy landscape for what looks to be an extended budget debate over the year. For one, most (though not all) policy uncertainty over expiring tax cuts and credits was settled for the foreseeable future. Congress is very unlikely to pick up any new revenue measures this year.
But the bill also highlights how far we are from meaningful deficit reduction. My colleagues and I at the Tax Policy Center have examined what happens to both spending and revenue paths, under the new law and under a scenario that incorporates other likely policies, including the permanent extension of current payment rates to Medicare physicians and a failure to abide by the spending sequester (which, you’ll recall, was a result of the super committee’s failure to reach a budget agreement in late 2011).
We also make an important assumption about the direction of discretionary spending in the long run. Under current law, discretionary spending, on both the defense and domestic sides of the budget, is scheduled to drop to historic lows. Under our “plus likely policies” scenario, we assume that discretionary spending doesn’t fall below its historical lows of 3 percent of GDP for defense and 3.2 percent of GDP for domestic spending. Those lows occurred in 1999 following a period of relative peace, rapid economic expansion, and few of the demographic pressures we now face.
Ben Harris over at TaxVox has more.
What the Public Doesn’t Understand About Social Security and Medicare
Posted: January 30, 2013 Filed under: Aging, Health and Health Policy, Income and Wealth, Shorts, Taxes and Budget 6 Comments »An earlier short highlighted my research with Caleb Quakenbush into how much people pay in Social Security and Medicare taxes over a lifetime, and how much they receive in benefits. For instance, we found that a two-earner couple making an average wage who turned 65 in 2010 would have paid $722,000 in Social Security and Medicare taxes over their lifetimes, but would receive $966,000 in benefits.
These types of numbers often generate outraged debate over how much seniors are “owed” based on what they “paid in” to Social Security and Medicare.
But there is another, more philosophical, issue that these numbers cannot address. Americans do not pay their taxes into a personal account that they can take out, plus interest, when they retire. The money paid into Social Security and Medicare has always been chiefly paid out immediately to older generations. The only exception has been some trust funds which have always been modest in size and are shrinking. Thus, Social Security is effectively a transfer system from young to old, and always has been.
We may feel that because we transferred money to our parents, our kids, in turn, owe us. But we must take into account also how much they can or should afford for this task as opposed to their own current needs for themselves and their children. Think of a one-family society, where three kids support their parents, but then those three kids have no children of their own (or only one or two children). What those three kids gave their parents informs us only slightly on what they can or should get from their own children if there are none or fewer of them. Likewise, when demographics change and there are fewer workers to support an aging population, society has to make adjustments, regardless of what some may otherwise think is “fair” or what they think is their entitlement.
For articles inspired by this research, see a recent PolitiFact.
Retired Couples Receiving More Years of Support under Social Security
Posted: January 18, 2013 Filed under: Aging, Income and Wealth, Shorts, Taxes and Budget 3 Comments »Increased time spent in retirement is a driving factor behind rising Social Security and Medicare costs. A couple that stopped working at the earliest Social Security retirement age in 1940 would expect to receive 19 years of retirement benefits; a similar couple in 2010 would expect 28 years of benefits. By 2080, couples could be receiving retirement support for 33 years.
This calculation assumes both partners are the same age and will have average life spans. Partners of different ages and those (often higher-income) couples who expect to live longer, such as nonsmokers, receive even more years of support.
As it turns out, these many years in retirement affect more than Social Security balances. Retiring longer also reduces the share of Social Security benefits spent on recipients in their last (e.g., ten) years of life and the income tax revenues to support other government functions.
Expected Years of Retirement Benefits, Earliest Year of Retirement
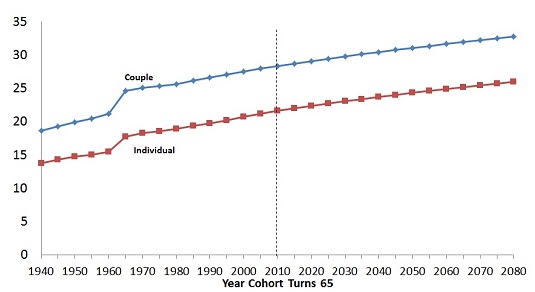
C. E. Steuerle and S. Rennane, Urban Institute 2010. Calculations based on mortality data from the 2010 OASDI Trustees’ Report.
Assumption: in a couple, at least one partner is still living. ERA was set at 62 for women in 1956 and men in 1961.
For more on this topic, see Correcting Labor Supply Projections for Older Workers Could Help Social Security and Economic Reform.
High-Income Charitable Giving and Higher Education
Posted: January 17, 2013 Filed under: Nonprofits and Philanthropy, Shorts 2 Comments »If reforms to the charitable deduction decrease giving among high-income donors, certain types of charities will be affected more than others. As the graph below from a 2012 Bank of America Study indicates, high-income donors give mostly to education, followed by organizations such as trusts and foundations that primarily support other nonprofits (referred to as giving vehicles). Thus, changes to tax law affecting only high-income taxpayers would disproportionately affect donations to educational institutions. However, the relationship isn’t as linear as this figure suggests. Take international organizations, for instance. They receive fewer donations from high-income givers than health organizations, but they rely on those donations more; many health organizations, such as hospitals, receive substantial amounts in fees for service. International organizations also may be among the primary recipients of grants from giving vehicles.
Distribution of High Net Worth Giving: More to Education
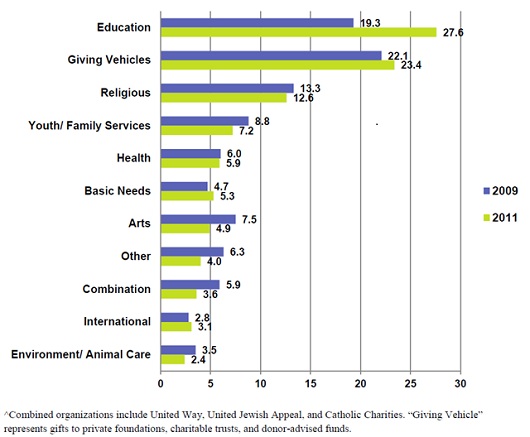
Source: 2012 Bank of America Study of High Net Worth Philanthropy.
Note: High net worth includes households with incomes greater than $200,000 and/or net worth more than $1,000,000 excluding the monetary value of their home.
For more interesting data, visit the Tax Policy and Charities project.
Why Current Revenue Proposals are Inadequate Compared to the Deficit
Posted: December 5, 2012 Filed under: Shorts, Taxes and Budget 3 Comments »Despite the ideological hype over revenue increases for the upper-income taxpayers and restricting itemized tax deductions, almost all the considered changes will tackle only a portion of the deficit.
As the graph below indicates, the Congressional Budget Office projects a fiscal year 2015 deficit under current policy of $883 billion, not far from the $1 trillion–plus deficits in the Great Recession and its early aftermath. By comparison, the Tax Policy Center calculates that revenue gained from repealing ALL itemized deductions would be only $183 billion. Smaller limitations on itemized deductions have smaller effects: President Obama’s proposal to limit the value of itemized deductions to 28 percent would raise only $15 billion. Capping itemized deductions at $50,000 would raise $59 billion, or $38 billion if the charitable deduction was excluded.
The value of all individual tax expenditures is $1.161 trillion, even larger than the deficit. But most revenue proposals—particularly those confined to a tiny portion of taxpayers and only a subset of various tax programs—also only chip away at that amount.

Sources: CBO Budget and Economic Outlook, U.S. Treasury Green Book, and Urban-Brookings Tax Policy Center.
* Tax expenditures estimate excludes payroll tax effects.
Notes: Baseline is current policy, which assumes extension of 2001 and 2003 tax cuts, except for Individual Income Tax expenditures, which uses Treasury’s baseline.
Several proposals are circulating concerning the Buffett Rule, aimed to insure a 30 percent minimum effective tax on those making $1 million or more a year. The proposal scored by the Tax Policy Center would eliminate the AMT and replace it with a “fair share tax” styled on the Buffett rule. The “fair share” part would raise $22 billion in 2015 (the amount shown in the graph above), but repealing the AMT would lose $54 billion.
Cutting Back on Charitable Incentives: The Case for Automobiles
Posted: November 30, 2012 Filed under: Nonprofits and Philanthropy, Shorts, Taxes and Budget 2 Comments »With Congress and the President seriously considering proposals to reduce various tax subsidies, the charitable deduction has come into play. As opposed to proposals that cut back on giving across the board, it may be worthwhile to consider other alternatives. This short note indicate some evidence on what happened when Congress recently cut back on allowances for donations of automobiles because of perceived abuses.
In 2003, a GAO study found suspiciously large unsubstantiated deductions for donations of vehicles to charity. In response to evidence that donors were claiming well in excess of the value of these deductions to charities, Congress in 2004 limited the deduction for vehicles worth over $500 to the charity’s actual selling price of the vehicles. It also required donors to attach a statement of sale indicating that it was “sold in an arm’s length transaction between unrelated parties” or a written statement that the charity would use the donated car in its programs. Higher deduction amounts were still allowed for charities that used the vehicles directly, as opposed to selling them.
The graph below shows that tax deductions claimed for vehicles fell sharply after enactment of this law.

Source: Gerald Auten, Department of Treasury.
For more information on noncash contributions generally, see “Noncash Charitable Contributions: Issues of Enforcement” which includes postings on noncash charitable contributions, an area worth $44 billion to nonprofit organizations in 2010.
Allocating Monies Where Unemployment Is Highest
Posted: November 15, 2012 Filed under: Job Market and Labor Force, Shorts 1 Comment »As Congress debates how to unwind from all the debt it is accumulating, it continues to face high unemployment around the nation. One possible deficit-reducing approach is to provide greater assistance or revenue sharing to those regions, or people in the regions, most suffering from high unemployment, while reducing some across-the-board supports.
To examine variation in unemployment, I would like to draw attention to some of the interesting interactive graphs available from Urban Institute’s MetroTrends web site. The graph below looks at unemployment in the top 100 metro areas in the United States. By clicking on a city, you can look at the unemployment rate going back to 2000 or compare unemployment between two cities.
Below is a screenshot; the interactive graph can be found at http://datatools.metrotrends.org/charts/metrodata/LAUSMap_files/LAUSMap.cfm.