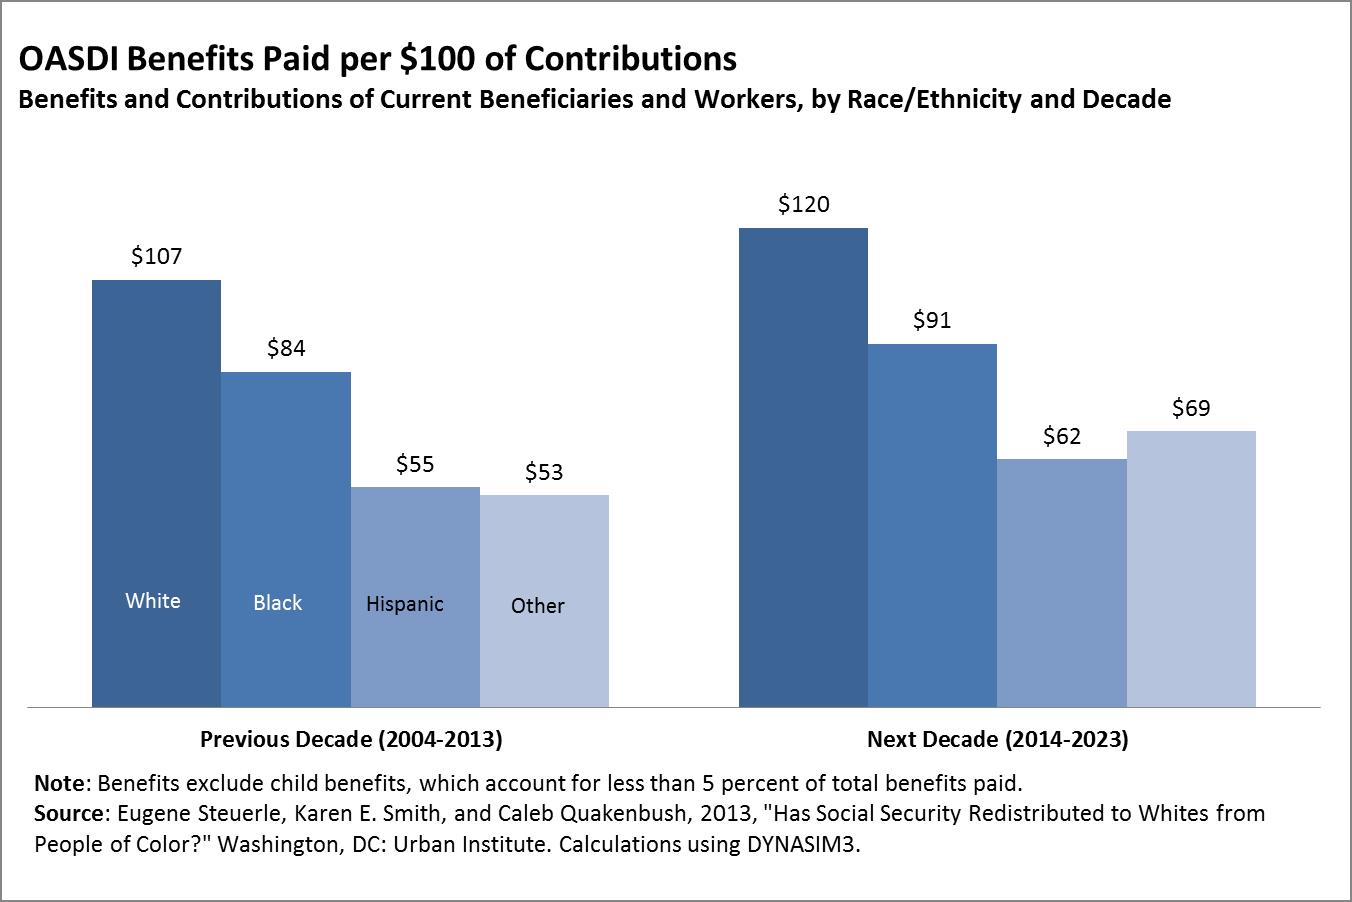
Has Social Security Redistributed to Whites from People of Color?
Posted: November 8, 2013 Filed under: Columns, Income and Wealth, Race, Ethnicity, and Gender 6 Comments »In a new brief, my colleagues and I examine how many features of Social Security combine to redistribute money among racial and ethnic groups over long periods of time, combining together generations. We find that the program as a whole, and especially its retirement portion, has likely redistributed from blacks, Hispanics, and other racial minorities to whites.
The major cause? When taxes are compared to benefits for each generation, the early generations of retirees got large windfalls, those retiring today come closer to breaking even, and tomorrow’s retirees on average will get back less than they pay in, assuming some modest interest rate could have been earned on their contributions or taxes. This phenomenon by itself wouldn’t cause interracial redistribution, but whites disproportionately occupy the high-return generations, while Hispanics, more recently immigrated groups, and blacks increasingly occupy the lower return generations.
The immigration part of the story is easy to understand. Hispanics and other recent immigrants weren’t around to receive the windfalls that came about as the system expanded over its early decades. Whenever Congress increased lifetime benefits for retirees and near-retirees, younger workers would be required to contribute for decades to support those higher benefits. Older workers would get those higher benefits with fewer years of additional contributions or, at times, none at all.
As for the redistribution from blacks, they disproportionately occupy the lower-return generations because of their larger family sizes. A simple analogy might be made with a two-family world where one couple has three kids and the second has one, but the kids all contribute the same $1,000 each to support the four parents, who all get the same benefit of $1,000 each. The larger family contributes $3,000 and gets back $2,000. The effect will be permanent unless some other redistributions over time offset this windfall gain for the smaller family.
Of course, these simple stories ignore Social Security’s other moving parts. Its progressive benefit formula, which I consider in many ways brilliant because it is based on lifetime rather than annual earnings, redistributes to those with lower lifetime earnings. At the same time, Social Security contains many regressive features. For instance, as a protection for old age it appropriately requires that payments be made in the form of annuities, but that ends up redistributing to those with higher incomes because they have higher-than-average life expectancies. Also, unlike private pensions where it would be illegal, single heads of household, often lower-income women, are required to contribute for spousal and survivor benefits they can’t receive.
Because of these various offsetting features, the retirement or old-age part of the system exhibits little net progressivity even before adding on this new multigenerational consequence of making each successive generation pay more for each dollar of benefit it receives.
When disability insurance is considered, it adds to significantly to progressivity in the sense of redistributing to those with lower incomes. From a broader perspective, of course, one can hardly consider it a plus that some racial and ethnic groups incur higher levels of disability, along with the huge losses of private income that Social Security does not replace.
The study does not contain policy prescriptions, though my own separate work has for very long time suggested the merits of substantively (not just symbolically) higher levels of minimum benefits and other progressive adjustments. Nor does the study contradict the success of Social Security in reducing poverty dramatically among the elderly, particularly in its early decades. It does suggest that as reform is being considered, we give serious attention to whether the system achieves its stated objectives, including the extent to which it really provides better protection for those individuals and classes who are less well off.
Both the left and right, I think it fair to say, have presumed that the system is far more progressive than it turns out to be—a more recent literature finding to which this study adds. Unfortunately, the Social Security debate, like so many we have today, tends to be argued on a thumbs-up or thumbs-down basis, rather than on how it might be better designed to meet society’s objectives.
Read more on Economix and Wonkblog.
Civil Rights and Economic Mobility
Posted: September 5, 2013 Filed under: Columns, Economic Growth and Productivity, Income and Wealth, Race, Ethnicity, and Gender 1 Comment »The 50th anniversary of “the March on Washington”—so famous and, in many ways, so successful that “the” is sufficient to define it—brought forth a gusto of stories about what had been achieved since then, including some very interesting blog posts by my colleagues. Several turned to data on the distribution of wealth, including some studies in which I participated, noting the lack of gains—especially in the past few decades—in the wealth and income of blacks and Hispanics relative to whites.
Those aggregate, raw figures on wealth and income act as a form of performance test on one aspect of government policy. They state rather emphatically that, whatever its merits, such policy was not sufficient to move the needle on wealth mobility across and among racial and other classes. Some simply draw the conclusion that we must redouble our efforts on programs that they have favored for a long time. Spend more on Medicare or Medicaid or cut tax rates or whatever. But what if that focus is wrong? What if the dominant liberal and conservative agendas over the past 50 years, at least when it came to social policy and taxes, never really had much to with mobility? What if the data compel us to adopt more dynamic, yet realistic, policies that put mobility and opportunity more at the forefront of policy in the 21st century?
Over these past few decades, liberal agendas have focused largely on the positive effects of ensuring that people had adequate income, food, health care, and so on—that is, consumption. Conservative agendas have focused largely on the negative effects of high income tax rates, particularly at the top of the income distribution. Often raising legitimate concerns about poverty or incentives, respectively, in many ways, each side has won its battle. Redistributive and other social welfare policies now dominate the $55,000 in federal, state and local spending, including tax subsidies, now spent on average per household, while tax rates at the top tend to be about half what they were from World War II to the early 1960s.
Relative to 50 years ago, fewer people are without food or food assistance, people can now retire on Social Security for many more years, health care has become far more life-sustaining, more people go to college, and, while economic growth hasn’t been great lately, we’re still about three times richer than we were. So the record isn’t all that bad, despite current travails. But, once again, those successes largely did not carry over to mobility among and across classes.
Here are just a few examples of how policies have given limited attention to mobility:
- Current welfare policy helps feed and house people, but it often discourages work by imposing very high costs on moderate-income households with children, as they can lose hundreds of dollars of benefits for each $1,000 they earn.
- Even while single parenthood remains a major source of poverty for many, that same welfare policy now penalizes—on the order of hundreds of billions of dollars—low-income couples with children who decide to get or remain married.
- Although investing in quality early childhood education appears to have a high payoff, the means testing of Head Start and other programs re-segregates our schools, with poorer kids often clustered together in classrooms separate from middle-class kids.
- Housing rental subsidies help people live in decent housing, but they also discourage home-buying and paying off a mortgage along the way, keeping lower-income families away from that classic and, for large segments of the population, most important mechanism for saving.
- Our retirement policies help most Americans live their later years in some comfort. But by encouraging early retirement, Social Security and other programs lead to an increased wealth gap among the elderly as richer classes retire later—hence, work and save longer—than poorer classes.
- Low tax rates may encourage entrepreneurship, but when they don’t raise enough revenue to pay our bills, they add to interest costs on the debt, gradually eroding support for investments in people, education, and similar efforts.
It’s not that liberals and conservatives advocating these older agendas don’t care about mobility. They’ll tell you that people with more sustenance will be able to work and study harder and entrepreneurs facing lower tax rates will create more jobs. But they try to claim too much for agendas that, though successful on some fronts, did not improve mobility in recent decades. The proof is in the pudding.
Raising these issues threatens those who fear that acknowledging failure on any front merely empowers those who advocate for the opposing agenda. And in today’s chaos that passes for policymaking, that is probably true. I don’t even know in what galaxy to place debates over previously nonpartisan issues like extending the debt ceiling so Congress can pay off its bills.
For me, it isn’t about abandoning the past. It’s simply about moving on.
Five Thoughts after Celebrating Independence Day
Posted: July 8, 2013 Filed under: Race, Ethnicity, and Gender, Shorts 2 Comments »A few years ago I emerged from my July 4 hovel at home and started attending fireworks celebrations again. Sometimes I settle in with the crowds on the National Mall in Washington, DC; other times I crowd at the last minute with the groups that gather on one of the many surrounding hilltops. What strikes me again and again as I merge into and mingle with the crowds is how much the experience unifies us. Here are five related thoughts:
- There’s something very special about July 4 and Thanksgiving Day, national holidays where we all come together to celebrate the many blessings we have received. What other holidays take us so outside ourselves and into the larger whole of our national community?
- Among the most jovial and lively of the participants on July 4 are the new immigrant communities, at least as I infer from their many accents. They cheer the loudest. Many have come far from conditions of poverty and tyranny to know real freedom. I like this. They inspire me.
- Whatever anyone thinks of immigration reform, our immigrant community largely organizes its protests over its desire to work and contribute. I contrast this particularly with those (not all) countries of Europe or Japan, where either immigration is discouraged or significant roadblocks are placed on immigrant work. Such places lose out on the intellectual and even genetic gains from diversity and gain the social problems that derive from keeping the young restless. I also applaud our founding fathers, who ameliorated what will be a perpetual problem in any rich country by having the good sense to attach citizenship to birth in the country. I know it’s arbitrary, but it certainly avoids some of the multigenerational problems and bitterness I’ve seen elsewhere.
- Symbolism and celebration help define who we are. Give John Adams early credit when writing his wife, Abigail, that “the second day of July, 1776 [he was off by two days—for good reason]…will be celebrated by succeeding generations as the great anniversary festival… it ought to be solemnized with pomp and parade…and illuminations, from one end of this continent to the other, from this time forward forever more.”
- I’m one of the luckiest people ever to live in this time and place. Aren’t you?
Growth in Income and Health Care Costs
Posted: June 4, 2013 Filed under: Columns, Economic Growth and Productivity, Health and Health Policy, Income and Wealth, Race, Ethnicity, and Gender 4 Comments »Worried about the stagnation of income among middle-income households? Or about the growth in health care costs? The two are not unrelated. In fact, middle-income families have witnessed far more growth than the change in their cash incomes suggest if we count the better health insurance most receive from employers or government. But is that all good news? Should ever-increasing shares of the income that Americans receive from government in retirement and other transfer payments go directly to hospitals and doctors as opposed to other needs of beneficiaries? Should workers receive ever-smaller shares of compensation in the form of cash?
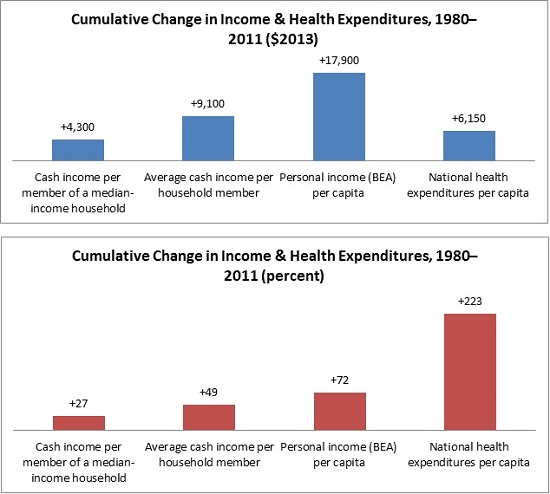
The stagnation of cash incomes in the middle of the income distribution now goes back over three decades. Consider the period from 1980 to 2011. Cash income per member of a median income household, which includes items like wages and interest and cash payments from government like Social Security, only grew by about $4,300 or 27 percent over that period, when adjusted for inflation. From 2000 to 2010, it was even negative. Yet according to data from the Bureau of Economic Analysis, per capita personal income—our most comprehensive measure of individual income—grew 72 percent from 1980 to 2011.
How do we reconcile these statistics? By disentangling the many pieces that go into each measure.
Growing income inequality certainly plays a big part in this story: much of the growth in either cash or total personal income was garnered by those with very high incomes. So the growth in average income, no matter how measured, is substantially higher than the growth for a typical or median person who shared much less than proportionately in those gains. But personal income also includes many items that simply don’t show up in the cash income measures. Among them is the provision of noncash government benefits, such as various forms of food assistance.
Health care plays no small role. In fact, real national health care expenditures per person grew by 223 percent or $6,150 from 1980 to 2011, much more than the growth in median cash income. If we assume that the median-income household member got about the average amount of health care and insurance, then we can see how little their increased cash income tells them or us about their higher standard of living.
Getting a bit more technical, there’s a danger of over-counting and under-counting health care costs here. Some of the median or typical person’s additional cash income went to extra health care expenses, so the additional amount he/she had left for all other purposes was even less than $4,300. However, individuals pay only a small share of their health care expenses; the vast majority is covered by government, employer, or other third-party payments. So, roughly speaking, typical or median individuals still got well more than half of their income growth in the form of health benefits.
The implications stretch well beyond middle-class stagnation. Employers face rising pressures to drop insurance so they can provide higher cash wages. For instance, providing a decent health insurance package to a family can be equivalent roughly to a doubling of employer costs for a worker paid minimum wage. The government, in turn, faces a different squeeze: as it allocates ever-larger shares of its social welfare budget for health care, it grants smaller shares to education, wage subsidies, child tax credits, and most other efforts. Additionally, the more expensive the health care the government provides to those who don’t work, the greater the incentives for them to retire earlier or remain unemployed.
In the end, the health care juggernaut leaves us with good news (that our incomes indeed are growing moderately faster than most headlines would have us believe) as well as bad news (that health care remains unmerciful in what it increasingly takes out of our budget).
Homeownership as a Means of Reducing Wealth Disparities
Posted: May 30, 2013 Filed under: Columns, Economic Growth and Productivity, Income and Wealth, Race, Ethnicity, and Gender 2 Comments »COAUTHORED WITH DOUG WISSOKER
A recent paper by Bayer, Ferreira, and Ross on mortgage delinquencies and foreclosures finds that people of color had greater problems once Recession hit than did many others in roughly equal circumstances, such as income and location, but with different racial backgrounds. We believe this is a useful, though not surprising, finding in ongoing studies of the impact of the Recession on different types of households. Yet we worry about how its results get extrapolated into policy recommendations.
The paper concludes that their research “raises concerns about homeownership as a vehicle for reducing racial wealth disparities”. We believe that one needs to be very careful in extrapolating lessons from the market of the mid-2000s to any market and to policies that would apply over time. Paying off mortgages is the primary means by which the majority of households, particularly low and moderate-income households, save over time. Discouraging such saving could easily add to already unequal distribution of wealth in society.
First, a quick summary of the findings. Combining several sources of data to look at racial differences in delinquent payments and foreclosures for mortgages for purchases and refinances originated between 2004 and 2008, the authors find that black and Hispanic borrowers had substantially higher delinquency and foreclosure rates than whites and Asians, even controlling for differences in circumstances such as the borrower’s credit score, the size of the interest rate spread of the loan, and the identity of the lender. In addition, the authors conclude that the racial gap in delinquent payments and foreclosures peaked for loans originating in 2006. From this, they conclude that people of color entering the market at the peak of the housing boom were particularly vulnerable to adverse economic conditions.
The authors attribute the racial difference found for blacks and Hispanics, even after trying to control for income or other differences, to items they couldn’t measure, including lower wealth and an accompanying lack of a financial cushion. This seems crucial to us and is also consistent with studies that income an incomplete predictor of upward or downward mobility. Work from the Urban Institute (here) shows that wealth differentials by race are much greater than income differentials. These differentials can play out in multiple ways across generations. For instance, wealthier families provide more inheritances and intergenerational transfers that support homebuying and downpayment levels that reduce foreclosure risk.
However, the authors’ concern about homeownership as a vehicle for reducing racial wealth disparities does not follow logically. Evidence here is at best circumstantial. Among other sources of disparate outcomes, consumer groups would point out that these types of findings more than anything highlight the disparate impact of abusive lending at the height of the housing boom.
Portfolio theory requires looking across different types of assets and debts, along with their associated expected returns and risks. Homeownership has risks, but so does renting. In fact, rental rates at times rise faster than the costs of homeownership, and in many parts of the country it has become cheaper to own than rent for those likely to be in a home long enough that transactions costs do not eat away at the ownership returns. Similarly, a household often must choose among debt instruments. Mortgages tend to have lower interest charges than most other forms of debt.
Most vehicles for getting a decent return on investment involve some risk. Saving accounts now paying negative, after-inflation, returns only prove the point in spades. If saving were proportionate to income, for instance, but lower-income individuals invest only in low or negative return assets, then wealth inequality necessarily would grow to be much greater than implied by levels of saving, potentially compounding adverse outcomes over time. Conversely, without discounting lessons from the Great Recession, low-cost, well-structured mortgages continue to be supported by the government (whether through FHA or the GSEs) partly for the very purpose of diversifying risk and effectively spreading wealth ownership.
This study is based on patterns of delinquency and foreclosure rates observed during a limited time period with unusually high foreclosure rates. But, wealth accumulation occurs over a very long time. Thus, even on this paper’s own terms, it’s not clear that reduced rates of homeownership would make low-income households or people of color better off over extended periods. We have found that most homeowners buying a decade or so before the Great Recession came through the longer period in good shape. Our own work also tends to show that black homeownership rates, even after controlling for income, are disproportionately low in both good and bad markets, raising serious questions about whether they are missing out on opportunities available to others.
Regardless of the effect on the difference in wealth disparity by race, homeownership is an effective way for many, though certainly not all, low- and moderate-income households to save. Equity in a home is the primary asset owned by low- and middle-income households, including blacks and Hispanics, by the time of retirement. Paying off a mortgage is the primary mechanism by which these households save, with all the virtues of a more automatic and regular saving vehicle. Reductions in the already low homeownership of people of color would almost certainly exacerbate over time the unequal distribution of wealth.
Wealth Accumulation by Race Over the Life Cycle
Posted: April 29, 2013 Filed under: Income and Wealth, Race, Ethnicity, and Gender, Shorts 1 Comment »While the income inequality among different racial and ethnic groups is significant, it is nothing compared to wealth inequality. In 2010, whites had six times more average wealth than blacks and Hispanics ($632,000 versus $103,000). The income gap, by comparison, was twofold ($89,000 versus $46,000).
In a recent study, several colleagues and I examine in more depth how these ratios are affected by wealth accumulation over a person’s lifetime. Early in wealth-building years (when adults are in their 30s), white families have 3.5 to 4 times the wealth of families of color. As adults age these initial racial differences grow both absolutely and relatively. Whites in the cohort we examined started with about three and a half times more wealth than blacks in their 30s but had seven times more wealth in their 60s. Compared with Hispanics, whites had four times more wealth in their 30s but nearly five times more wealth three decades later.
Or consider how ratios would vary if each family saved the same share of its income and earned the same rate of return on those savings. Ignoring inheritances, the wealth gap should resemble the income gap, not be three times as large.
While the Great Recession didn’t cause the wealth disparities between whites and minorities, it did exacerbate them. The 2007–09 economic slowdown brought about sharp declines in the wealth of white, black, and Hispanic families alike, but Hispanics experienced the largest decline. Lower net equity in homes accounts for much of Hispanics’ wealth loss, while retirement accounts are where blacks were hit hardest.
Something is definitely going on. Whatever other conclusions one may draw, I think our tax and social policies are doing a pretty poor job of helping individuals attain the types of protections that private wealth-holding offers. In fact, wealth disparities among races have expanded over the past 27 years, which should have liberals and conservatives alike questioning the unintended consequences of their policy victories, or at least their policy focus, over that period.
For more analysis of the wealth gap between whites and minorities, read the brief Less Than Equal: Racial Disparities in Wealth Accumulation or watch The Racial Wealth Gap in America. This work has been cited in the New York Times.
Any Way You Look at It, Young Americans Have Less Wealth than Their Parents
Posted: April 9, 2013 Filed under: Children, Economic Growth and Productivity, Income and Wealth, Race, Ethnicity, and Gender, Shorts 3 Comments »My colleagues and I recently published research showing that younger age groups are falling behind their parents in wealth accumulation and explaining the story behind our numbers. Some have raised questions about how we use our data, and I want to take some time to further explain our research.
Our study shows that the average wealth, or net worth, of these younger age groups has fallen fairly dramatically relative to older age groups. In response, some have said that median wealth is more important than average wealth. In fact, both are important. Average wealth tells us how a group is prospering as a whole relative to other groups; median wealth tells us how some “typical” person might be doing. One complication with focusing on median wealth is that it doesn’t show where all the remaining wealth goes. In a similar vein, if you were studying small business ownership by age or race, the median value might be zero for all groups. The average values would be greater than zero and thus would allow comparisons by groups.
Consider the median household age 56–64 in 2010. True, it is only slightly richer than the median household of a similar age in 1983 ($179,400 versus $143,150). Still, the median household age 29–37 in 1983 had $46,234 in wealth, but the median household in that age group in 2010 had only $15,900, less than half compared to their parents.
Median and average net worth by age is reported here. Come to your own conclusion.
Another footnote: Our study did not look at the decline in defined benefit wealth. However, the availability of such wealth has declined more for younger than older groups. Moreover, the valuation of defined benefits and annuities goes up for those who have them when interest rates go down. Older individuals with more defined benefit wealth technically saw the value of wealth go up after the Great Recession.
You can slice and dice these data in many ways, but the empirical data speak for themselves: younger age groups have fallen behind in relative terms. All sorts of factors are involved: the Great Recession and its impact on housing, student debt, wages, and so forth. Each is worthy of our attention.
Lost Generations? Wealth Building Among the Young
Posted: March 15, 2013 Filed under: Children, Columns, Economic Growth and Productivity, Income and Wealth, Race, Ethnicity, and Gender 19 Comments »The young have been faring poorly in the job market for some time now, a condition only exacerbated by the Great Recession. Now comes disturbing news that they are also falling behind in their share of society’s wealth and their rate of wealth accumulation.
Signe Mary McKernan, Caroline Ratcliffe, Sisi Zhang, and I recently examined how different age groups have shared in the rising net wealth of the U.S. economy. Despite the recent recession, our economy in 2010 was about twice as rich both in terms of average incomes and net worth as it was 27 years earlier in 1983. But not everyone shared equally in that growth.
Younger generations have been particularly left behind. Roughly speaking, those under age 46 today, generally the Gen X and Gen Y cohorts, hadn’t accumulated any more wealth by the time they reached their 30s and 40s than their parents did over a quarter-century ago. By way of contrast, baby boomers and other older generations, or those over age 46, shared in the rising economy—they approximately doubled their net worth.
Older Generations Accumulate, Younger Generations Stagnate
Change in Average Net Worth by Age Group, 1983–2010
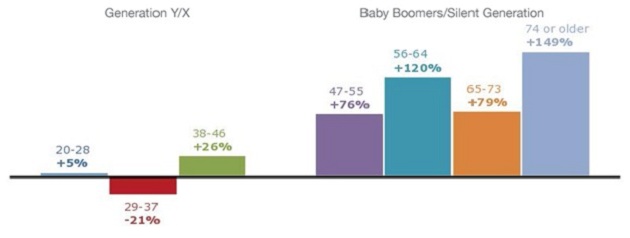
Source: Authors’ tabulations of the 1983, 1989, 1992, 1995, 1998, 2001, 2004, 2007, and 2010 Survey of Consumer Finances (SCF).
Notes: All dollar values are presented in 2010 dollars and data are weighted using SCF weights. The comparison is between people of the same age in 1983 and 2010.
Households usually add to their saving as they age, while income and wealth rise over time with economic growth. If these two patterns apply consistently and proportionately, then one might expect to see, say, a parent generation accumulate $100,000 by the time its members were in their 30s and $300,000 in their 60s, whereas their children might accumulate $200,000 by their 30s and $600,000 by their 60s.
This normal pattern no longer holds for the younger among us. However, this reversal didn’t just start with the Great Recession; it seems to have begun even before the turn of the century. The young increasingly have been left behind.
Potential causes are many. The Great Recession hit housing hard, but it particularly affected the young, who were more likely to have the largest balances on their loans and the least equity relative to their home values. If a house value fell 20 percent, a younger owner with 20 percent equity would lose 100 percent in housing net worth, whereas an older owner with the mortgage paid off would witness a drop of only 20 percent.
As for the stock market, it has provided very low returns over recent years, but those who hung on through the Great Recession had most of their net worth restored to pre-recession values. Bondholders usually came out ahead by the time the recession ended as interest rates fell and underlying bonds often increased in value. Also making out well were those with annuities from defined benefit pension plans and Social Security, whose values increase when interest rates fall (though the data noted above exclude those gains in asset values). Older generations hold a much higher percentage of their portfolios in assets that have recovered or appreciated since the Great Recession.
As I mentioned earlier, however, the tendency for lesser wealth accumulation among the younger generations has been occurring for some time, so the special hit they took in the Great Recession leaves out much of the story. Here we must search for other answers to the question of why the young have been falling behind. Likely candidates for their relatively worse status, many of which are correlated, include
- a lower rate of employment when in the workforce;
- delayed entry into the workforce and into periods of accumulating saving;
reduced relative pay, partly due to their first-time-ever lack of any higher educational achievement relative to past generations; - their delayed family formation, usually a harbinger and motivator of thrift and homebuilding;
- lower relative minimum wages; and
- higher shares of compensation taken out to pay for Social Security and health care, with less left over to save.
When it comes to conventional wisdom and media attention to distributional issues, there’s a tendency simply to attribute any particular disparity, such as the young falling behind in wealth holdings, to the growth in wealth inequality in society. But the two need not be correlated. Disparities can grow within both younger and older generations, without the young necessarily falling behind as a group.
Whatever the causes, we should also remember that public policy now places increased burdens on the young, whether in ever-higher interest payments on federal debts they will be left or the political exemption of older generations from paying for their underfunded retirement and health benefits. At the same time, state and local governments have given education lower priority in their budgets; pension plans for government workers now grant reduced and sometimes zero net benefits to new, younger hires; and homeownership subsidies post-recession increasingly favor the haves over the more risky have-nots.
Maybe, more than just maybe, it’s time to think about investing in the young.